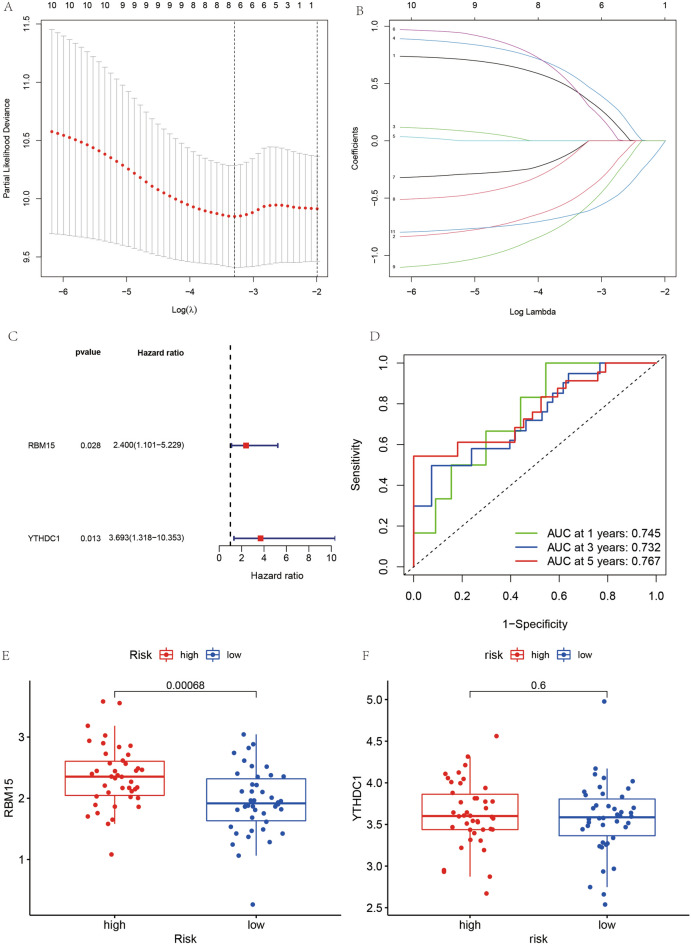
Figure 7.
Construction diagram of the prognostic model for osteosarcoma. (A) and (B) represent the results of LASSO regression analysis to find the minimum penalty coefficient. (C) Shows the results of multivariate COX regression analysis, plotting the forest plot of 2 genes for constructing the prognostic model of osteosarcoma. (D) Represents the ROC diagnostic curve. (E) and (F) indicate the expression of the two genes used to construct the model in the high and low risk groups.

