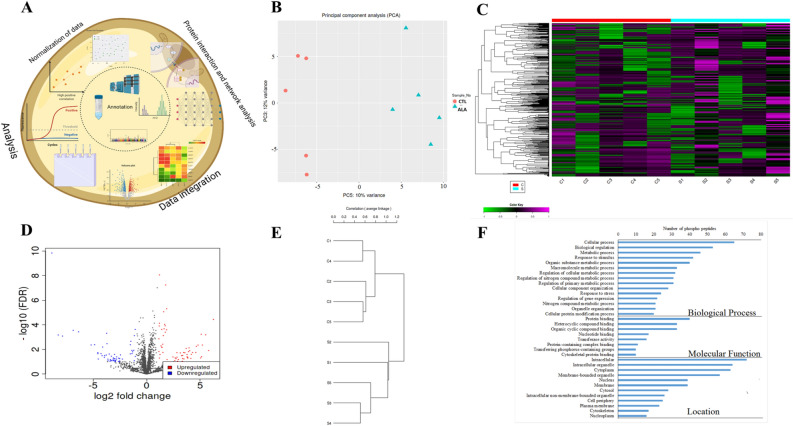
Figure 3.
Phospho-proteomic analysis of insulin-stimulated adipose tissue from postpartum (PP) of dairy cows supplemented peripartum with ALA. Dairy cows were divided into two groups from 21 to 60 days PP; (i) CTL—encapsulated saturated fat, (ii) ALA—flaxseed supplement providing α-linolenic acid (ALA). n = 5 per treatment. (A) Work flow diagram of phospho-proteome analysis. (B) Principal component analysis (PCA) of AT phospho-proteome; CTL samples are denoted as red circles, whereas ALA samples are denoted as blue triangles. (C) Heat map analysis of AT phospho-proteome, low phosphopeptide intensity is denoted in green, whereas high intensity is denoted in purple. Each cow in the study is numbered and represented in columns. (D) Volcano plot analysis of AT phospho-proteome; the P value (≤ 0.05) is represented on the Y-axis and FDR (± 1.5) is represented on the X-axis. Each dot represents one protein; red indicates more, whereas blue indicates fewer phosphoproteins in AT. (E) Correlation of CTL vs ALA adipose generated by the IDEP9.5 server where c1, c2, c3, c4, and c5 represent CTL; s1, s2, s3, s4, and s5 represent ALA-supplemented cows. (F) GO analysis of AT phosphoproteome supplemented with ALA including the biological process category, the molecular function category, and the cell component category. Image was generated using www.Biorender.com.

