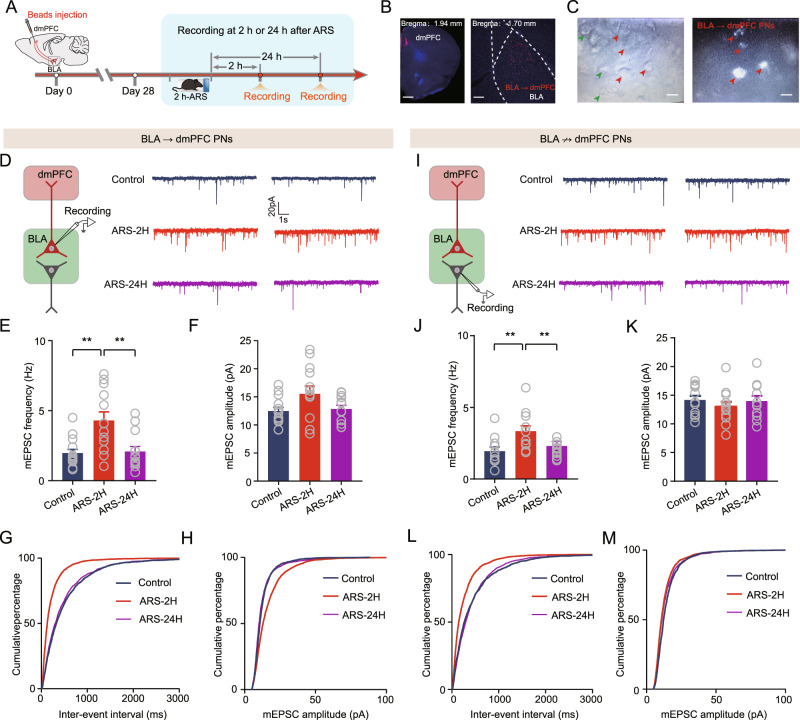
Fig. 3. Acute stress enhances glutamatergic transmission onto onto both BLA → dmPFC and BLA ↛ dmPFC PNs.
A Schematic showing the experimental procedures. B Representative images showing the injection site in dmPFC (left) and red Retrobeads-labeled BLA → dmPFC PNs (right). Scale bar: 500 (left) and 100 (right) μm. C Infrared DIC (left) or fluorescent (right) images of BLA → dmPFC (red arrow heads) or BLA ↛ dmPFC PNs (green arrow heads). scale bar: 10 μm. D Representative traces showing mEPSCs in BLA → dmPFC PNs (scale bar:1 s, 20 pA). Summary plots of averaged mEPSC frequency (E) and averaged mEPSC amplitude (F) in BLA → dmPFC PNs. Control mice: n = 14 neurons/5 mice; ARS-2H mice, n = 13 neurons/4 mice; ARS-24H mice, n = 13 neurons/4 mice. Frequency: Kruskal–Wallis H test, Kruskal–Wallis statistic: 11.03, p = 0.004. Dunn’s post hoc comparison, ARS-2H vs. control, **p < 0.01; ARS-24H vs. ARS-2H, **p < 0.01. Amplitude: one-way ANOVA measures, F(2,37) = 3.08, p = 0.0579. Summary plots of cumulative probability of the interevent interval (G) and cumulative probability of the amplitude (H) of mEPSCs in BLA → dmPFC PNs. I Representative traces showing mEPSCs in BLA ↛ dmPFC PNs (scale bar:1 s, 20 pA). Summary plots of average mEPSC frequency (J) and averaged mEPSC amplitude (K) in BLA ↛ dmPFC PNs. Control mice: n = 11 neurons/4 mice; ARS-2H mice, n = 12 neurons/4 mice; ARS-24H mice, n = 11 neurons/4 mice. Frequency: one-way ANOVA measures, F(2,31) = 7.06, p = 0.003. Bonferroni post hoc comparison, ARS-2H vs. control, **p < 0.01; ARS-24H vs. ARS-2H, **p < 0.01. Amplitude: one-way ANOVA measures, F(2,31) = 0.4728, p = 0.6277. L, M Summary plots of cumulative probability of the interevent interval (L) and cumulative probability of the amplitude (M) of mEPSCs in BLA ↛ dmPFC PNs. All data are presented as the mean ± SEM.

