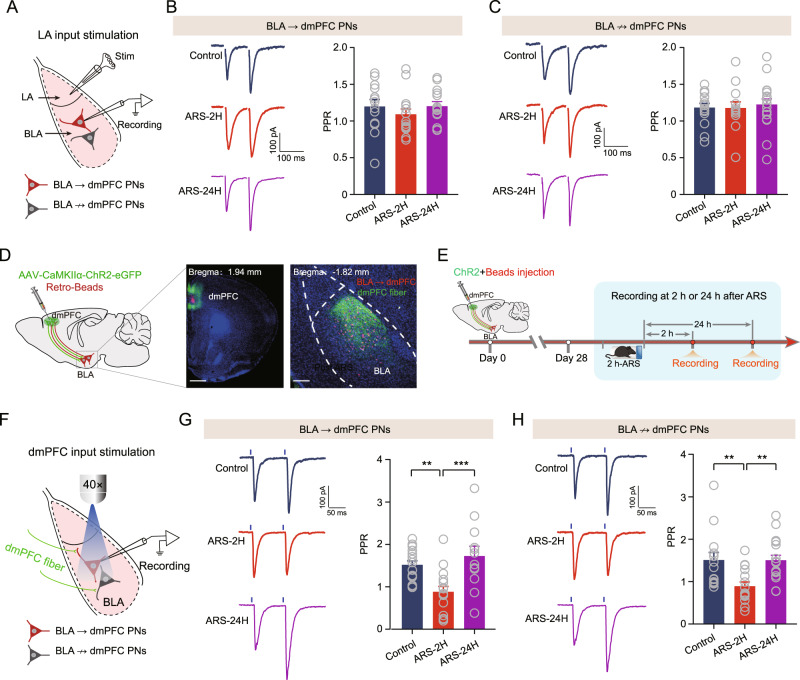
Fig. 4. Acute stress selectively augments dmPFC-evoked glutamatergic transmission onto BLA PNs.
A Schematic showing recording of BLA → dmPFC or BLA ↛ dmPFC PNs in response to electrostimulation of LA inputs. B Representative traces showing evoked EPSCs in BLA → dmPFC PNs upon paired electrostimulation of LA inputs (separated by 100 ms). Scale bar: 100 ms, 100 pA (left) and summary plots of paired pulse ratio (PPR) in dmPFC → BLA PNs (right). Control mice: n = 13 neurons/4 mice; ARS-2H mice, n = 15 neurons/5 mice; ARS-24H mice, n = 14 neurons/4 mice. One-way ANOVA measures, F(2,39) = 0.6918, p = 0.5067. C Same as in B except that the data were from BLA ↛ dmPFC PNs. Control mice: n = 15 neurons/5 mice; ARS-2H mice, n = 13 neurons/4 mice; ARS-24H mice, n = 18 neurons/6 mice. One-way ANOVA measures, F(2,43) = 0.1332, p = 0.8757. D Schematic showing co-injection of ChR2-carrying AAV and red fluorescent Retrobeads into dmPFC. Retrobeads were used to differentiate the putative BLA → dmPFC and BLA ↛ dmPFC PNs in BLA (left) and representative images showing the injection site in dmPFC (middle) and red Retrobeads-labeled BLA → dmPFC PNs and dmPFC inputs in BLA (right). Scale bar: 500 (middle) and 100 (right) μm. E Schematic showing the experimental procedures. F Schematic showing recording of the postsynaptic responses in BLA → dmPFC or BLA ↛ dmPFC PNs to optogenetic activation of dmPFC inputs. G Representative traces showing evoked EPSCs in BLA → dmPFC upon paired light stimuli of dmPFC inputs (separated by 100 ms). Scale bar: 50 ms, 100 pA (left) and summary plots of paired pulse ratio (PPR) in BLA → dmPFC PNs (right). Control mice: n = 17 neurons/6 mice; ARS-2H mice, n = 16 neurons/5 mice; ARS-24H mice, n = 12 neurons/4 mice. One-way ANOVA measures, F(2,42) = 8.986, p = 0.0006. Bonferroni post hoc comparison, ARS-2H vs. control, **p < 0.01; ARS-24H vs. ARS-2H, ***p < 0.001. H Same as in G except that the data were from BLA ↛ dmPFC PNs. Control mice: n = 15 neurons/5 mice; ARS-2H mice, n = 16 neurons/5 mice; ARS-24H mice, n = 17 neurons/6 mice. Kruskal–Wallis H test, Kruskal–Wallis statistic: 14.36, p < 0.001. Dunn’s post hoc comparison, ARS-2H vs. control, **p < 0.01; ARS-24H vs. ARS-2H, ***p < 0.001. All data are presented as the mean ± SEM.

