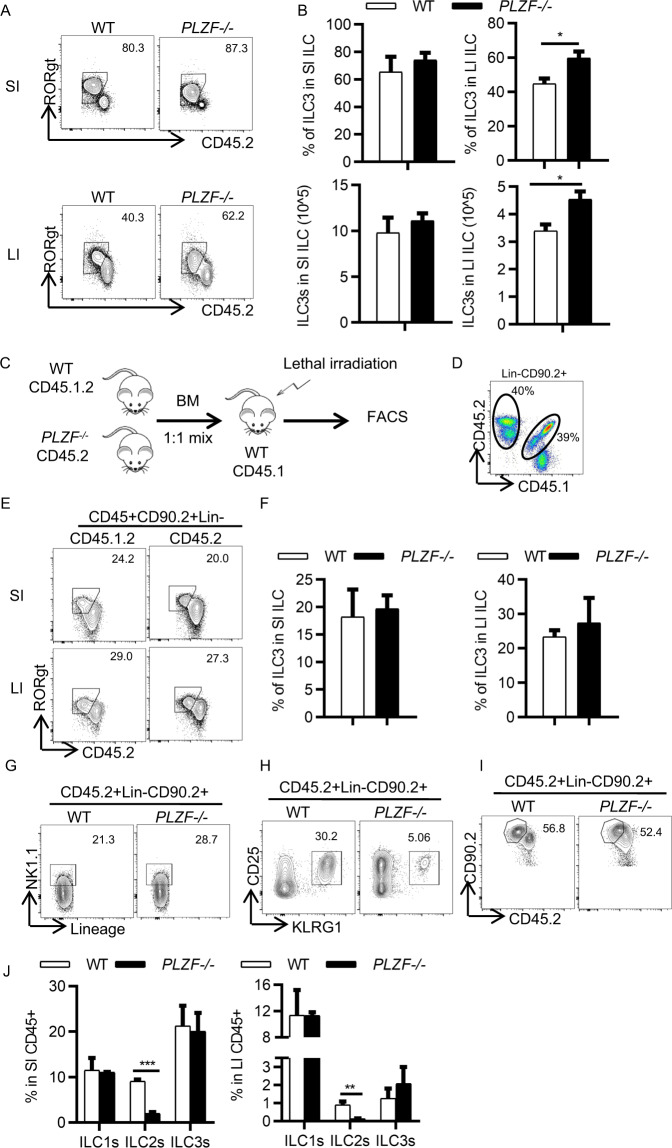
Fig. 2.
PLZF is not required for ILC3 development. A, B Small intestine (SI) and large intestine (LI) LPLs were isolated from WT or PLZF−/− mice (n = 4–6). A Representative flow cytometry plots for ILC3s (CD45.2midRORγt+) gated on CD45+Lin−CD90.2+. B Frequencies of ILC3s in CD45+Lin−CD90.2+ cells and total numbers of ILC3s in WT and PLZF−/− mice. C–F Competitive bone marrow chimeric mice were generated, and ILC3s were analyzed 8 weeks later (n = 3). C Experimental scheme for bone marrow transfer. BM from the CD45.2 PLZF−/− or CD45.1.2 WT mice were mixed 1:1 and transplanted into lethally irradiated recipients (CD45.1+). Eight weeks after engraftment, the donor BM-derived ILC3s (CD45.2+ PLZF−/− and CD45.1.2+ WT) were analyzed by flow cytometry. D Representative flow cytometry plots for LI LPLs from bone marrow chimeric mice. E Representative flow cytometry plots for ILC3 -gated on CD45+Lin−CD90.2+ from LPLs of bone marrow chimeric mice. F Frequencies of ILC3s in SI and LI LPLs from bone marrow chimeric mice. G ILCP cells were sorted from the bone marrow of WT or PLZF−/− mice and transplanted into lethally irradiated Rag2−/−Il2rg−/− recipient mice. The development of ILCs was analyzed by flow cytometry 8 weeks later (n = 4). Representative flow cytometry plots for ILC1s (G), ILC2s (H), and ILC3s (I) in SI LPLs. J Frequencies of ILC1s, ILC2s and ILC3s in SI and LI LPLs of recipient mice. Data are represented as the mean ± SEM. Error bars show SEM. *P < 0.05; **P < 0.01

