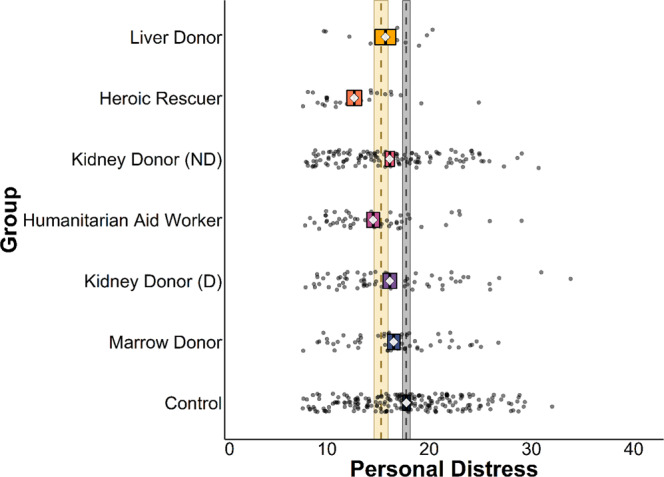
Fig. 2. Personal Distress across six groups of altruists and controls.

Gray dashed line and ribbon represent control group mean and 95% CIs (N = 207), yellow dashed line and ribbon represent combined altruist group mean and 95% CIs (N = 347), diamonds represent means of individual groups, box widths represent 95% CIs. Multivariate regressions compared all altruistic groups against controls simultaneously using two-sided tests (in lieu of separate tests for which corrections for multiple comparisons would be appropriate).
