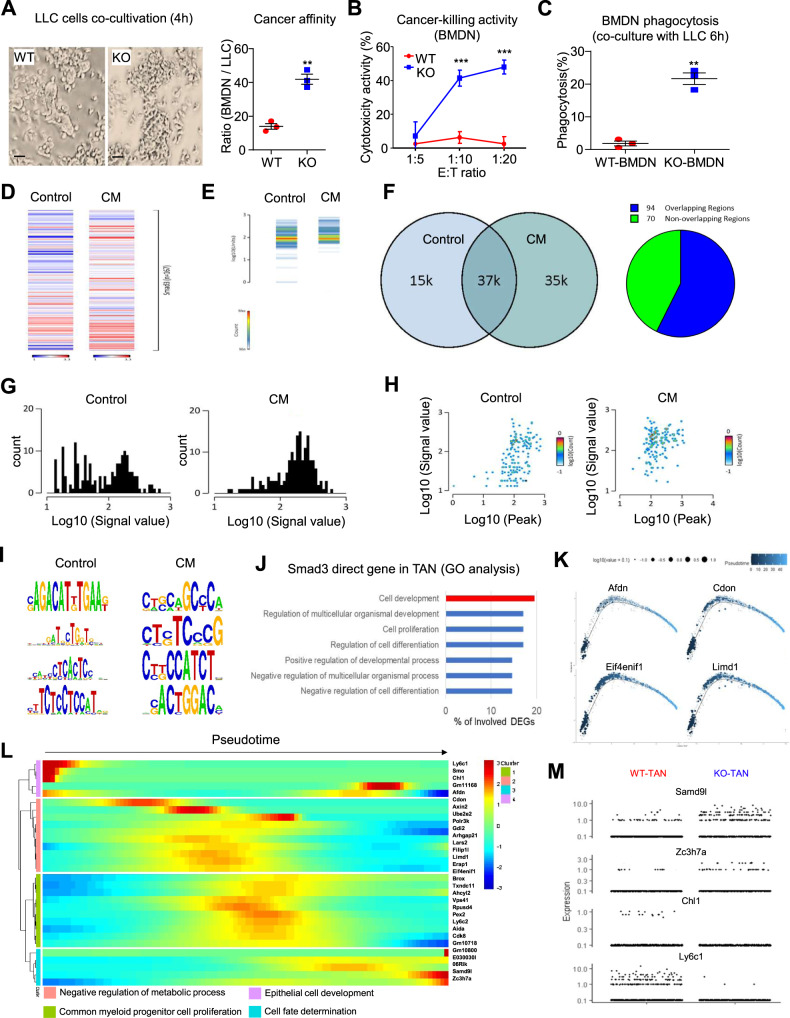
Fig. 6. Smad3 regulates the development of TANs at the genomic level.
A–C Smad3-WT and Smad3-KO-BMDN were co-cultured with LLC cells and assayed for; A binding of BMDN to LLC cells, B killing of LLC cells at different ratios of BMDN to LLC cells, and C phagocytosis of Dil-labeled LLC cells (**P < 0.01, ***P < 0.001 vs. WT-BMDN, n = 3 independent samples, two-tailed t-test) respectively. D–J Smad3-WT-BMDN (pooled from 4 mice /group) were cultured with 10% LLC-CM or normal media (control) for 2 h and analysed by Smad3-specific ChIP-seq. A substantial change in Smad3 binding to the genome was evident in BMDN stimulated by LLC-CM as shown by; D, E heatmap analysis, F overlap region chart, G enrichment plot, H correlation plot, and I binding motif analysis. J Gene ontology (GO) annotation reveals Smad3 directly regulates genes associated with cell development and differentiation in BMDNs stimulated with LLC-CM. Expression profiles of Smad3 target genes (K) related to neutrophil development (Afdn, Cdon, Elf4enif1, and Limd1) (statistical significance calculated from Monocle package) and L their functional annotation along the developmental pathway TANs (as in Fig. 3I). M Expression plot of N1 (Smad9l and Zc3h7a) and N2 (Chl1 and Ly6c1) Smad3 target genes in Smad3-WT and Smad3-KO TANs. Scale bar, 50 μm. A–C Data represents mean ± SEM from three independent experiments. The exact P values of WT-BMDN vs. KO-BMDN are 6A. P = 0.0021. 6B. P = 0.0001(1:10), P = 0.0001(1:20). 6C. P = 0.003. Source data are provided as a Source Data file.

