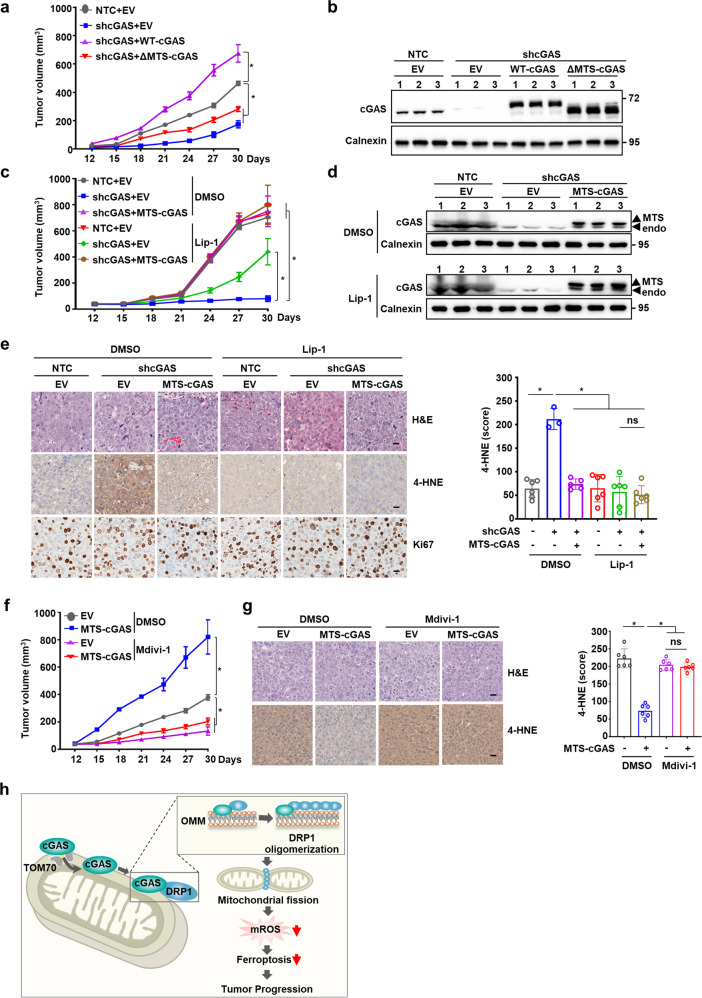
Fig. 5. Mitochondrial cGAS promotes tumor progression by suppressing ferroptosis.
a Tumor growth analysis of Hep3B xenografts with knockdown of endogenous cGAS and overexpression of wild-type cGAS (WT-cGAS) or cGAS mutant (ΔMTS-cGAS). The indicated Hep3B cells were subcutaneously injected into male nude mice (n = 5 for each group). Tumor sizes were measured starting from 12 days after inoculation. b Western blotting analysis of the protein levels of cGAS in Hep3B xenograft tumors with the indicated genotypes. Calnexin served as the loading control. c Tumor growth analysis of Hep3B xenografts with the indicated genotypes treated with or without Lip-1. The indicated Hep3B cells were subcutaneously injected into male nude mice (n = 5 for each group). Lip-1 (10 mg/kg) was injected intraperitoneally every other day. Tumor sizes were measured starting from 12 days after inoculation. d Western blotting analysis of the protein levels of cGAS in Hep3B xenograft tumors with the indicated genotypes treated with or without Lip-1. Calnexin served as the loading control. e Representative images of IHC staining for 4-HNE or Ki67 in the Hep3B xenograft tumors with the indicated genotypes treated with or without Lip-1. Scale bars, 20 μm. 4-HNE staining was quantitated using the Histo-score (H-score) in IHC assays. f Tumor growth analysis of Hep3B xenografts with endogenous cGAS knockdown and exogenous MTS-cGAS overexpression treated with or without Mdivi-1. The indicated Hep3B cells were subcutaneously injected into male nude mice (n = 5 for each group). Mdivi-1 (25 mg/kg) was injected intraperitoneally every other day. Tumor sizes were measured starting from 12 days after inoculation. g Representative images of IHC staining for 4-HNE in the Hep3B xenograft tumors with endogenous cGAS knockdown and exogenous MTS-cGAS overexpression treated with or without Mdivi-1. Scale bars, 20 μm. 4-HNE staining was quantitated using the H-score in IHC assays. h Schematic cartoon showing that mitochondria-localized cGAS interacts with DRP1 to facilitate its oligomerization and function, thus preventing mitochondrial ROS accumulation and ferroptosis. For a, c and e–g, data are presented as mean ± SEM. P value was calculated by two-tailed unpaired Student’s t-test (e, g), or two-way ANOVA (a, c, f). *P ≤ 0.05; ns, not significant.

