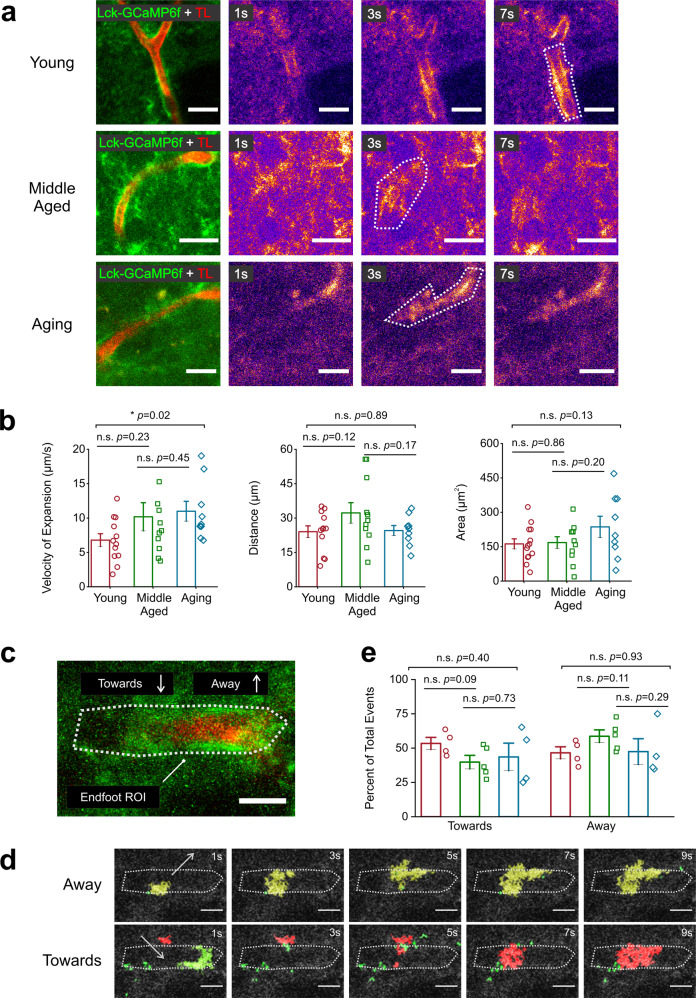
Fig. 2. Aging increases the velocity of expanding Ca2+ waves in astrocyte endfeet.
a Representative t-stacks of an expanding endfoot Ca2+ wave in the DLS of young (top), middle-aged (middle), and aging (bottom) mice is shown. Panels to the right of t-stacks show representative pseudo-colored time lapse images of endfoot Ca2+ waves. The white dotted lines in time-lapse images outline the maximum area attained by expanding endfoot Ca2+ waves, scale bar = 15 μm. b Bar graphs showing the velocity (left), distance traveled (middle), and area (right) of endfoot Ca2+ waves. c For analysis using AQuA, ROIs were manually drawn to demarcate the area where events would be analyzed in relation to the BV (white dotted line), scale bar = 10 μm. d Example time lapses of events moving away (top) or towards (bottom) the endfoot ROI, scale bar = 10 μm. (e) Bar graph comparing the percentage of expanding Ca2+ waves detected by AQuA that either expanded towards or away from the BV. For a, b, young mice: n = 13 ROIs and 5 blood vessels from 3 mice, for middle-aged mice: n = 11 ROIs and 4 blood vessels from 3 mice, and for aging mice: n = 9 ROIs and 4 blood vessels from 3 mice. For the velocity panel the p value is based on a Mann-Whitney test and the distance and area panel p values are based on two sample t-tests. For d, young mice: n = 4 ROIs and 4 blood vessels from 3 mice, for middle-aged mice: n = 5 ROIs and 4 blood vessels from 3 mice, and for aging mice: n = 4 ROIs and 4 blood vessels from 3 mice. For comparisons of events moving towards or away from the BV, two-sample t tests were used to determine p values. All error bars are S.E.M.

