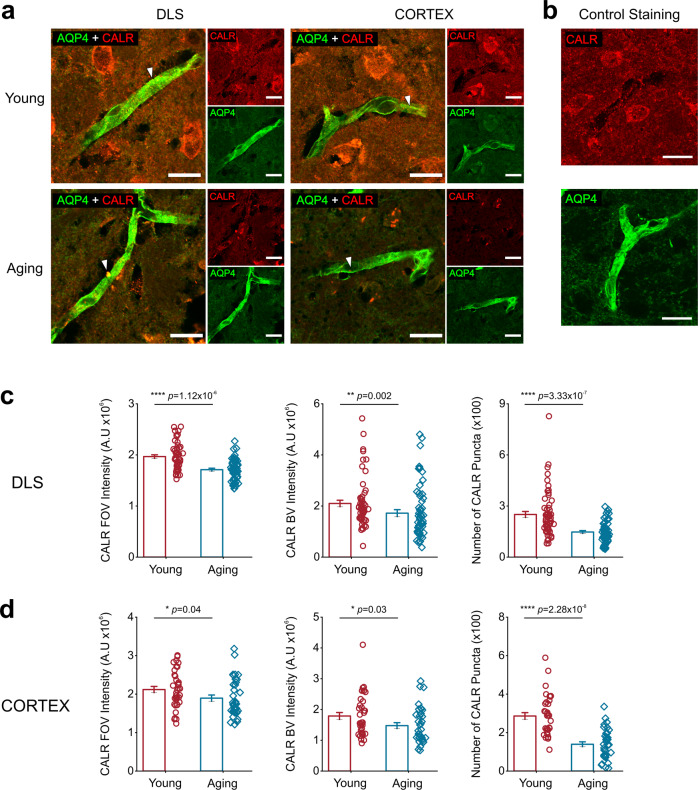
Fig. 5. Aging reduces CALR expression levels in astrocyte endfeet and in the neuropil of the DLS and adjacent cortex.
a Representative single plane confocal images from the DLS or cortex of young (top) and aging (bottom) mice co-labeled with CALR (red) and AQP4 (green), scale bar = 15 μm. The white arrows point to individual CALR puncta that coincide with AQP4 positive blood vessel staining. b Single plane confocal images from young mice stained with either CALR or AQP4 alone, scale bar = 15 μm. Bar graphs comparing neuropil CALR intensity (left), CALR intensity within AQP4 positive BVs (middle left), the number of CALR puncta in AQP4 positive BVs (middle right) in the DLS (c) or cortex (d). For CALR in the DLS, young and aging mice n = 54 blood vessels from 9 striatal sections and 3 mice per age group. For the cortex, young and aging mice n = 36 blood vessels from 9 striatal sections and 3 mice per age group. Error bars are S.E.M, all p values are based on Mann-Whitney tests.

