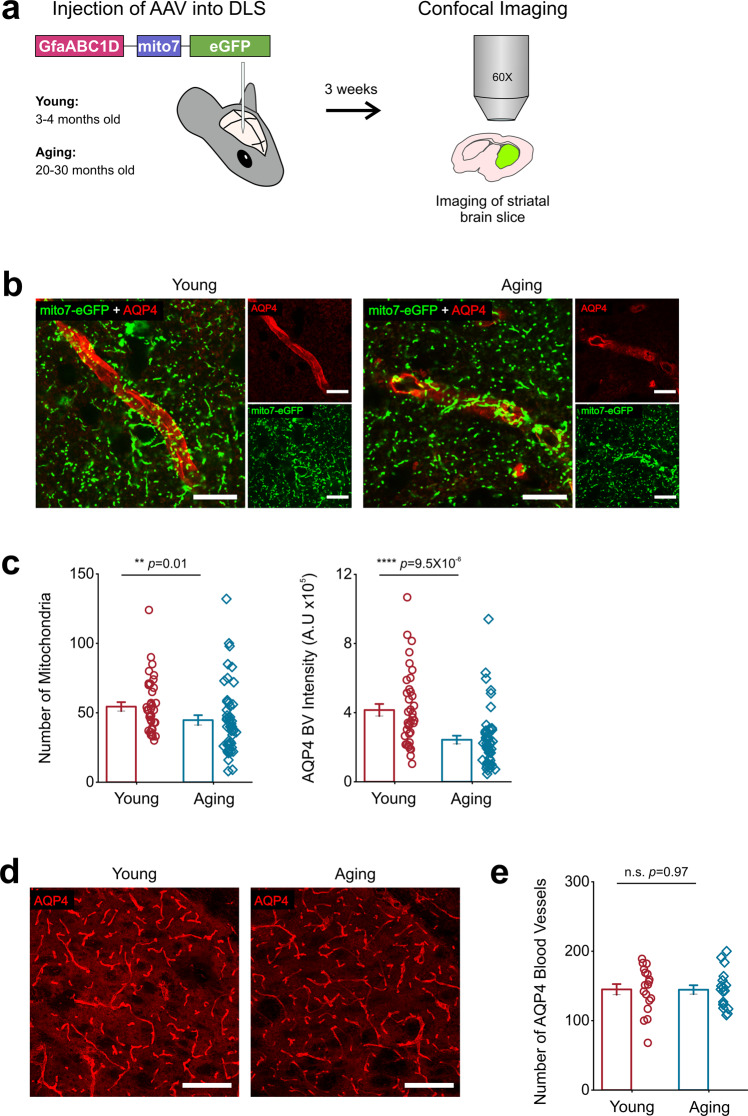
Fig. 6. Aging reduces the number of mitochondria in astrocyte endfeet and AQP4 expression in the DLS.
a AAV-GfaABC1D-mito7-eGFP was injected into the DLS of young and aging mice. 3 weeks later, striatal sections were imaged to obtain single plane images of mitochondria in AQP4 labeled BVs. b Representative single plane confocal images from the DLS of young (left) and aging (right) mice expressing AAV-GfaABC1D-mito7-eGFP (green) and stained with AQP4 (red), scale bar = 15 μm. c Bar graph comparing the number of mitochondria in AQP4 labeled BVs (left) and AQP4 intensity (right) in young and aging mice. d Representative z-stacks of blood vessels labeled with AQP4 in the DLS of young (left) and aging (right) mice, scale bar = 150 μm. e Bar graph comparing the number of AQP4 labeled blood vessels in young and aging mice. For mitochondria counting and AQP4 intensity, young mice n = 38 blood vessels from 9 striatal sections and 3 mice and aging mice: n = 49 blood vessels from 9 striatal sections and 3 mice per age group. Error bars are S.E.M, p values are based on Mann-Whitney tests. For the number of AQP4 blood vessels, n = 6 DLS FOV from 3 mice each for young and aging mice. Error bars are S.E.M. and the p value is based on a two-sample t-test.

