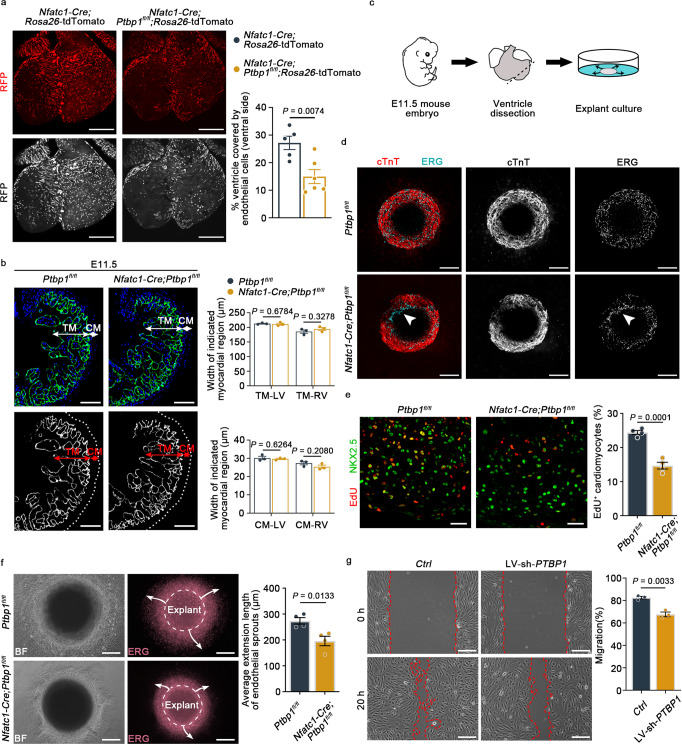
Fig. 5. Ptbp1 knockdown affects endothelial cell migration and cardiomyocyte proliferation.
a Representative images and quantification showing the significantly decreased migration of endothelial cells (labeled with RFP) in E13.5 Nfatc1-Cre;Ptbp1fl/fl;Rosa26-tdTomato mice compared to Nfatc1-Cre;Rosa26-tdTomato mice, which were assessed by the percentage of endothelial cell coverage on the ventral side of the heart. Scale bars, 200 µm. n = 5 mice for Nfatc1-Cre;Rosa26-tdTomato group, n = 6 mice for Nfatc1-Cre;Ptbp1fl/fl;Rosa26-tdTomato group. b Immunofluorescence staining of EMCN in heart sections from E11.5 Ptbp1fl/fl and Nfatc1-Cre;Ptbp1fl/fl mice. Scale bars, 100 µm. The graph shows the thickness of the compact myocardium (CM) and trabecular myocardium (TM) of E11.5 Ptbp1fl/fl and Nfatc1-Cre;Ptbp1fl/fl mice. n = 3 mice per group. c Schematic diagram showing the experimental strategy of explant culture. d Immunostaining for cTnT (red) and ERG (cyan) in ventricular explants from Ptbp1fl/fl and Nfatc1-Cre;Ptbp1fl/fl mice after 2 days culture. Scale bars, 200 µm. The arrowheads indicate decelerated endothelial cell migration in the explanted tissues. e Left: immunostaining for NKX2.5 (red) and EdU (green) in Ptbp1fl/fl and Nfatc1-Cre;Ptbp1fl/fl ventricular explants cultured for 2 days. Scale bars, 25 µm. Right: Quantification of the EdU-positive cardiomyocytes in ventricular explants. n = 4 explants per group. f Representative images and quantification of ventricular explants showing the migration of endothelial cells (labeled with ERG) at 5 days after culture. The arrows indicate the direction of endothelial cell sprouting. Scale bars, 200 µm. n = 4 explants per group. g Representative images and quantification of the in vitro scratch assays in primary human umbilical endothelial cells (HUVECs) after PTBP1 knockdown (LV-sh-PTBP1). Scale bars, 200 µm. n = 3 independent experiments. BF bright field, TM trabecular myocardium, CM compact myocardium, LV left ventricle, RV right ventricle, Ctrl control lentivirus-shRNA, LV-sh-PTBP1 lentivirus-shRNA-PTBP1. The data are presented as the mean ± s.e.m. P values were calculated by unpaired two-tailed t test. Source data are provided as a Source Data file.

