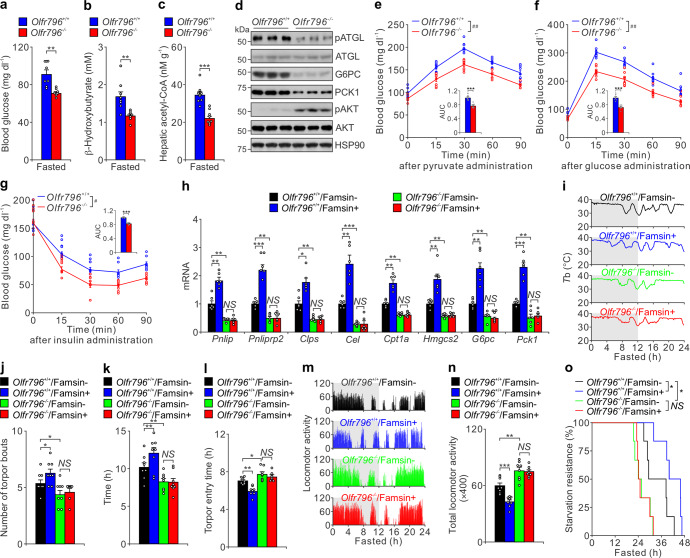
Fig. 6. Olfr796 knockout attenuates metabolic adaptations to fasting.
a–c Blood glucose (a), plasma β-hydroxybutyrate (b) and hepatic acetyl-CoA (c) levels from overnight fasted 8–10-week-old Olfr796+/+ and Olfr796–/– male mice. Data are shown as means ± SEM. Comparison of different groups was carried out using unpaired two-tailed Student’s t-test (a–c). n = 8 mice. d Immunoblots showing the effect of Olfr796 knockout on hepatic lipolysis and gluconeogenesis from liver extracts of 8–10-week-old male mice. e–g Pyruvate tolerance test (e), glucose tolerance test (f) and insulin tolerance test (g) results from 8–10-week-old Olfr796+/+ and Olfr796–/– male mice. The relative AUC is shown in the inset of each panel. Data are shown as means ± SEM. Comparison of different groups was carried out using two-way ANOVA followed by Tukey’s test (curve data, #P < 0.05, ##P < 0.01) or unpaired two-tailed Student’s t-test (AUC data, ***P < 0.001). n = 8 mice. h qPCR results showing relative mRNA levels of genes involved in lipolysis (Pnlip, Pnliprp2, Clps, Cel), lipid oxidation (Cpt1a), ketogenesis (Hmgcs2) and gluconeogenesis (G6pc, Pck1) from liver extracts of overnight fasted 8–10-week-old Olfr796+/+ and Olfr796–/– male mice treated with or without famsin. Data are shown as means ± SEM. Comparison of different groups was carried out using two-way ANOVA followed by Tukey’s test. *P < 0.05, **P < 0.01, ***P < 0.001. NS no statistical significance. n = 6 mice. i–o Effect of Olfr796 knockout on torpor evaluated by Tb (i), torpor frequency (j), time for Tb < 35 °C (k), torpor entry time (l), locomotor activity (m), relative total locomotor activity (n) and starvation resistance (o) of fasted 8-week-old male mice. Failure of starvation resistance was judged as Tb < 28 °C following a quick decrease in Tb below the environmental temperature. 400 μg/kg famsin was intraperitoneally injected after 4 h fasting. The gray and white backgrounds (i, m) indicate 12-h periods of darkness and light, respectively. Data are shown as means ± SEM. Comparison of different groups was carried out using two-way ANOVA followed by Tukey’s test (j–l, n) or log-rank test (o). *P < 0.05, **P < 0.01. NS no statistical significance. n = 6–8 mice.

