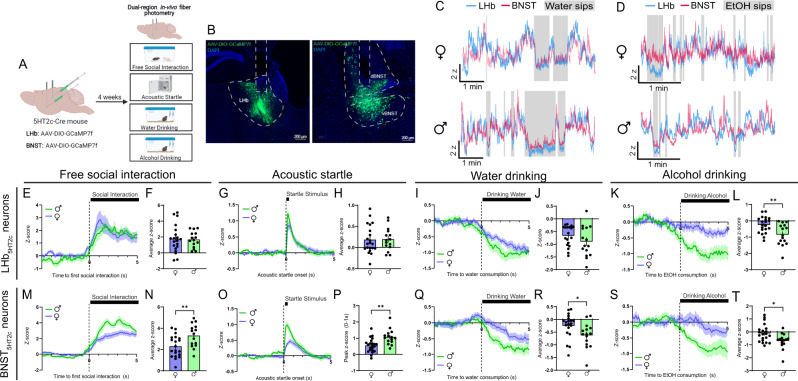
Fig. 1. In-vivo LHb5HT2c and BNST5HT2c calcium signals are modulated by exposure to affective stimuli.
A, Surgical schematic and experimental timeline for GCaMP fiber photometry experiments. B Representative viral infections and fiber placements in LHb (left) and BNST (right). Similar viral placement was reproduced in n = 37 mice. C Representative traces for water drinking session (individual mice). D Representative traces for alcohol drinking session (individual mice). E Peri-event plot of LHb5HT2c GCaMP activity during the first interaction with a novel juvenile social target (Females n = 20 mice/1 trial; Males: n = 15 mice/1 trial). F Average z-score of LHb5HT2c GCaMP signal for 0–5 s post interaction (Females n = 20 mice/1 trial, Males: n = 15 mice/1 trial). G Peri-event plot of LHb5HT2c GCaMP activity during the acoustic startle test (Females: n = 21 mice/10 trials; Males: n = 15 mice/10 trials). H Average z-score of LHb5HT2c GCaMP signal for 0–5 s post startle stimulus (Females: n = 21 mice/10 trials; Males: n = 15 mice/10 trials). I Peri-event plot of LHb5HT2c GCaMP activity during voluntary water consumption (Females: n = 21 mice/1-4 bouts; Males: n = 15 mice/1–4 bouts). J Average z-score of LHb5HT2c GCaMP signal for 0–5 s post water drinking bout start (Females: n = 21 mice/1–4 bouts; Males: n = 15 mice/1–4 bouts). K Peri-event plot of LHb5HT2c GCaMP activity during voluntary alcohol consumption (Females: n = 21 mice/1-4 bouts; Males: n = 15 mice/1–4 bouts). L Average z-score of LHb5HT2c GCaMP signal for 0-5 s post alcohol drinking bout start, p = 0.0038 (Females: n = 21 mice/1-4 bouts; Males: n = 15 mice/1–4 bouts). M Peri-event plot of BNST5HT2c GCaMP activity during the first interaction with a novel juvenile social target (Females: n = 20 mice/1 trial; Males: n = 15 mice/1 trial). N Average z-score of BNST5HT2c GCaMP signal for 0–5 s post interaction, p = 0.0073 (Females: n = 20 mice/1 trial; Males: n = 15 mice/1 trial). O Peri-event plot of BNST5HT2c GCaMP activity during the acoustic startle test (Females: n = 22 mice/10 trials; Males: n = 15 mice/10 trials). P Peak z-score of BNST5HT2c GCaMP signal for 0–1 s post startle stimulus, p = 0.0012 (Females: n = 22 mice/10 trials; Males: n = 15 mice/10 trials). Q Peri-event plot of BNST5HT2c GCaMP activity during voluntary water consumption (Females: n = 20 mice/1–4 bouts; Males: n = 15 mice/1–4 bouts). R Average z-score of BNST5HT2c GCaMP signal for 0–5 s post water drinking bout start, p = 0.0296 (Females: n = 20 mice/1–4 bouts; Males: n = 15 mice/1–4 bouts). S Peri-event plot of BNST5HT2c GCaMP activity during voluntary alcohol consumption (Females: n = 21 mice/1–4 bouts; Males: n = 15 mice/1–4 bouts). T Average z-score of BNST5HT2c GCaMP signal for 0–5 s post water drinking bout start, p = 0.0103 (Females: n = 21 mice/1-4 bouts; Males: n = 15 mice/1–4 bouts). Unless otherwise stated, statistical comparisons were performed using a two-tailed Student’s unpaired t test. All data are represented as mean ± SEM. *p < 0.05, **p < 0.01. Source data are provided as a Source Data file. Created with Biorender.com.

