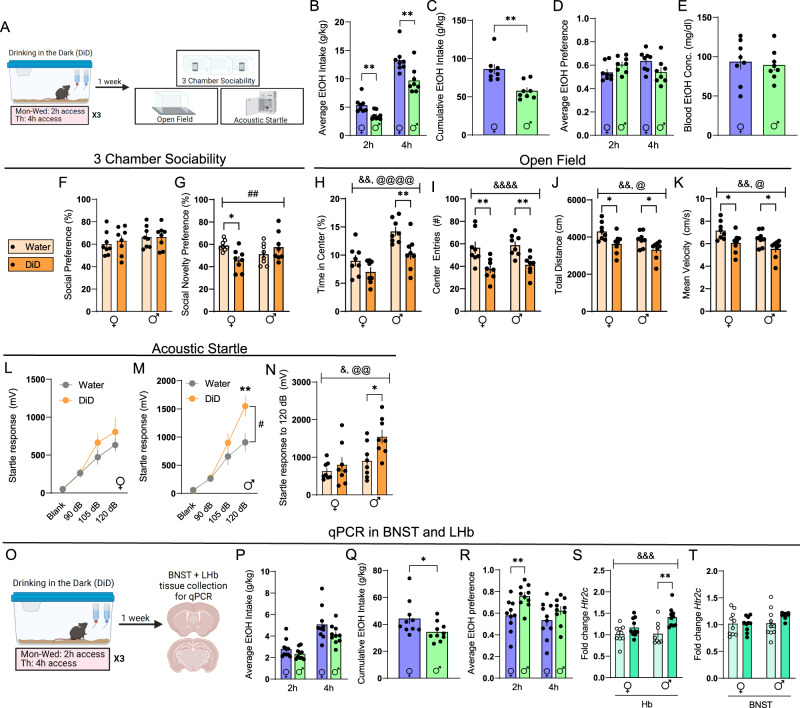
Fig. 5. DiD induces unique affective disturbances in males and females.
A Experimental timeline for DiD behavioral studies. B Average alcohol intake in DiD, two-tailed Student’s unpaired t-tests, p2h = 0.0042, p4h = 0.0069C Cumulative alcohol intake in DiD, two-tailed Student’s unpaired t-test, p = 0.0017. D Average alcohol preference in DiD, two-tailed Student’s unpaired t-tests, p2h = 0.0841, p4h = 0.0685. E Blood alcohol concentration immediately following 4h of DiD, two-tailed Student’s unpaired t-test. F Social preference in the 3-chamber sociability test. G Social novelty preference in the 3-chamber sociability test, psexXDiD = 0.008. H Percent time in center of open field, pDiD = 0.0019, psex < 0.0001. I Center entries open field, pDiD < 0.0001. J Total distance in open field, pDiD = 0.0013, psex = 0.0366. K Mean velocity in open field, pDiD = 0.0013, psex = 0.0366. L Acoustic startle behavior, females (10 trials/dB), two-way repeated measures ANOVA. M Acoustic startle behavior, males (10 trials/dB), two-way repeated measures ANOVA followed by Holm-Sidak’s post-hoc, pDiD = 0.0821, pDiDXdB = 0.0055. N Acoustic startle behavior, 120 dB only (10 trials), pDiD = 0.0164, psex = 0.0034. O Experimental timeline for DiD qPCR studies. P Average alcohol intake in DiD, two-tailed Student’s unpaired t tests, p2h = 0.1589, p4h = 0.1012. Q Cumulative alcohol intake in DiD, two-tailed Student’s unpaired t-test, p = 0.0448. R Average alcohol preference in DiD, two-tailed Student’s unpaired t tests, p2h = 0.0054, p4h = 0.1964. S Relative expression of Htr2c mRNA in Hb, pDiD = 0.0005, psex = 0.0902, pDiDXsex = 0.1012. T Relative expression of Htr2c mRNA in BNST. For panels 3B-3N, Females: water n = 8 mice, DiD n = 8 mice; Males: water n = 8 mice, DiD n = 8 mice. For panels 3P–3R, Females: n = 10 mice; Males: n = 10 mice. For panels 3S and 3T, Females: water n = 10 mice/3 replicates, DiD n = 10 mice/3 replicates; Males: water n = 10 mice/3 replicates, DiD n = 10 mice/3 replicates. Unless otherwise stated, statistical comparisons were performed using two-way ANOVA followed by Holm-Sidak’s post-hoc. All data are presented as mean ± SEM. & denotes effect of DiD (&p < 0.05, &&p < 0.01, &&&p < 0.001, &&&&p < 0.0001), @ denotes effect of sex (@p < 0.05, @@p < 0.01, @@@p < 0.001, @@@@p < 0.0001), # denotes interaction (sex × DiD or DiD × stimulus strength, #p < 0.01, ##p < 0.01), and * denotes post-hoc p < 0.05, ** denotes post-hoc p < 0.01. Source data are provided as a Source Data file. Created with Biorender.com.

