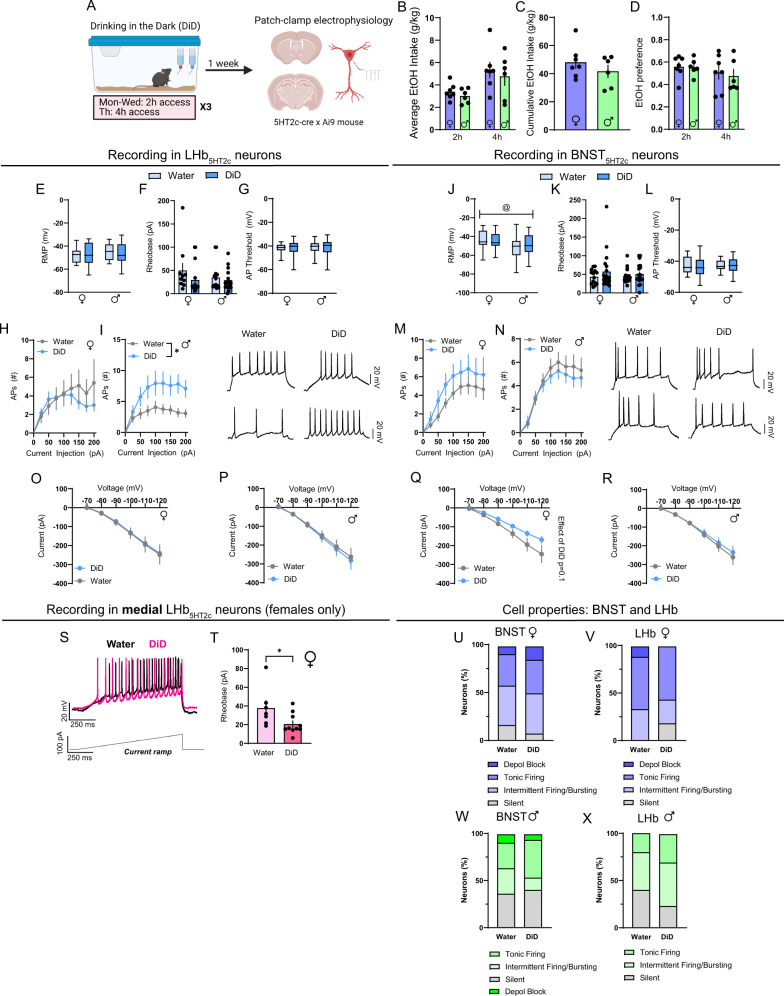
Fig. 6. DiD induces physiological adaptations in LHb5HT2c and BNST5HT2c.
A Experimental timeline for DiD electrophysiology studies. B Average alcohol intake in DiD, two-way Student’s unpaired t-tests. C Cumulative alcohol intake in DiD, two-way Student’s unpaired t test. D Average alcohol preference in DiD, two-way Student’s unpaired t tests. E Resting membrane potential (RMP) in LHb5HT2c neurons. F LHb5HT2c rheobase. G LHb5HT2c action potential (AP) threshold. H LHb5HT2c elicited APs, females, two-way repeated measures ANOVA. I LHb5HT2c elicited APs, males, two-way repeated measures ANOVA followed by Holm-Sidak’s post-hoc, pDiD = 0.0236, pDiDXcurrent = 0.0512. J Average RMP in BNST5HT2c neurons, psex = 0.0190. K BNST5HT2c rheobase. L BNST5HT2c AP threshold. M BNST5HT2c elicited APs, females, two-way repeated measures ANOVA. N BNST5HT2c elicited APs, males, two-way repeated measures ANOVA. O Voltage–Current plot for LHb5HT2c females, two-way repeated measures ANOVA. P Voltage–Current plot for LHb5HT2c males, two-way repeated measures ANOVA. Q Voltage–current plot for BNST5HT2c females, two-way repeated measures ANOVA, pDiD = 0.1032, pDiDXvoltage = 0.0701. R Voltage–Current plot for BNST5HT2c males, two-way repeated measures ANOVA. S Representative trace in medial LHb5HT2c during rheobase test. T Quantification of rheobase values in medial LHb5HT2c in females, two-way Student’s unpaired t test, p = 0.0157 (water n = 5 mice/7 cells; DiD n = 5 mice/10 cells). U Breakdown of cell properties at RMP, BNST females. V Breakdown of cell properties at RMP, LHb females. W Breakdown of cell properties at RMP, BNST males. X Breakdown of cell properties at RMP, LHb males. Depol block = silent at greater than −40 mV. BNST Females: water n = 6 mice/10 cells, DiD n = 6 mice/19 cells; BNST Males: water n = 5 mice/16 cells, DiD n = 5 mice/16 cells. LHb Females: water n = 7 mice/14 cells, DiD n = 6 mice/19 cells; LHb Males: water n = 6 mice/19 cells, DiD n = 6 mice/19 cells. Unless otherwise stated, statistical comparisons were performed using two-way ANOVA followed by Holm-Sidak’s post-hoc. All data except for box plots are represented as mean ± SEM. For box plots, center line is the mean, box limits are 25th–75th percentiles, whiskers are min to max. & denotes effect of DiD, @ denotes effect of sex, # denotes interaction (sex × DiD or DiD × current), and * denotes post-hoc p < 0.05. Source data are provided as a Source Data file. Created with Biorender.com.

