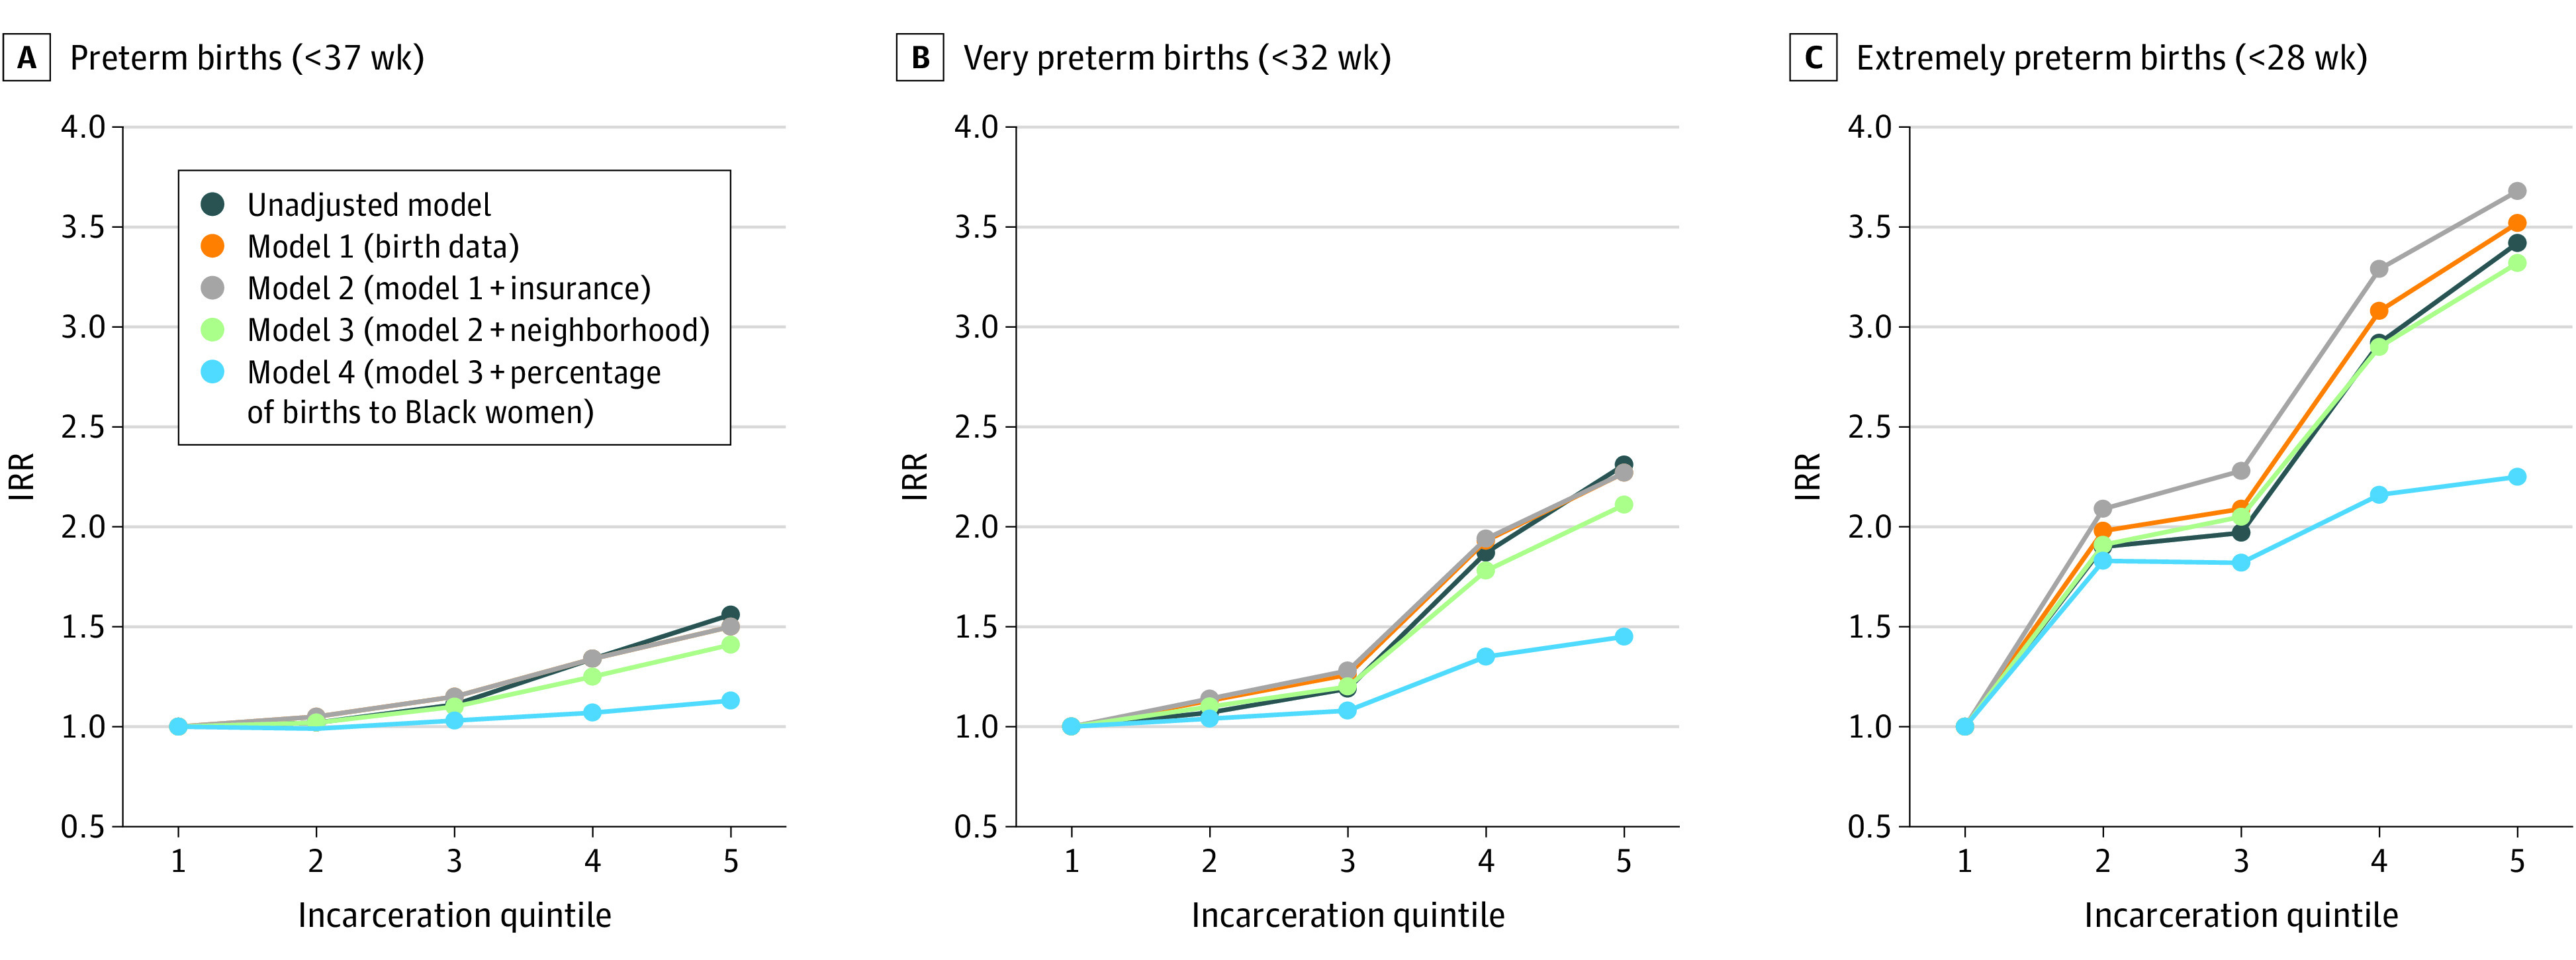
Figure 1. Association of Neighborhood Incarceration Rate and Preterm Birth.

Graphs show incidence rate ratios (IRRs) of preterm birth (A), very preterm birth (B), and extremely preterm birth (C) by neighborhood incarceration quintile. The lowest incarceration quintile serves as the reference with an IRR of 1.0 in all models.
