Figure 1.
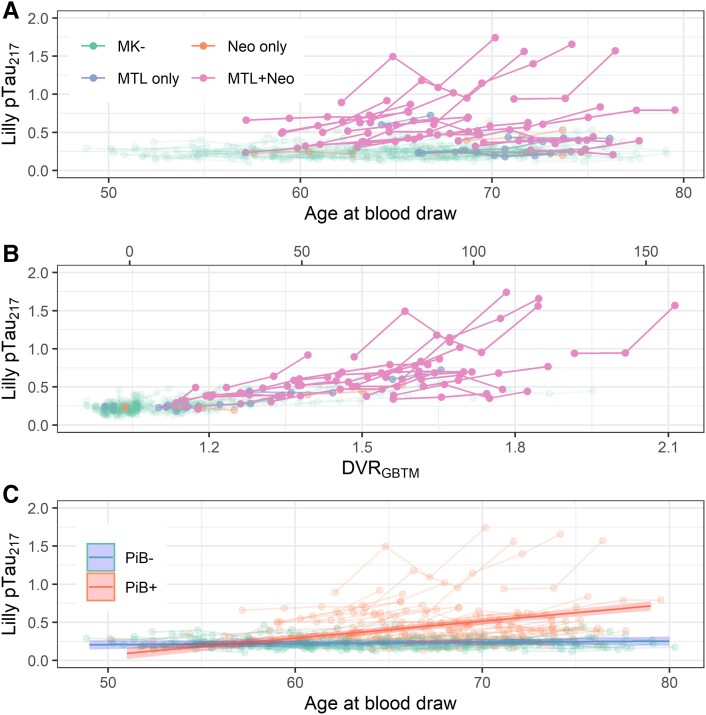
Longitudinal plasma . Observations from a single participant are shown with connected edges. (A) Plasma as a function of age at blood draw. Colour indicates the extent of tau burden for each participant as indicated on tau PET (MK- = no tau signal; MTL only = tau signal in medial temporal lobe only; Neo only = tau signal in neocortex only; MTL+ Neo = tau signal in both medial temporal lobe and neocortex). (B) Plasma as a function of estimated PiB DVR at the time of plasma acquisition (). Colour indicates the extent of tau burden as indicated on tau PET. (C) Plasma as a function of age at blood draw. Colour indicates amyloid PET positivity. Lines with shaded confidence bands represent slope estimates from a linear mixed effects model of as a function of the interaction of age and amyloid positivity, the results of which were reported in Table 2B (t(508.84) = 7.96, P = 0.000000000000011). DVR = distribution volume ratio; GBTM-DVR = group-based trajectory modelled DVR from amyloid PET; PiB = Pittsburgh compound B; = phosphorylated tau 217.

