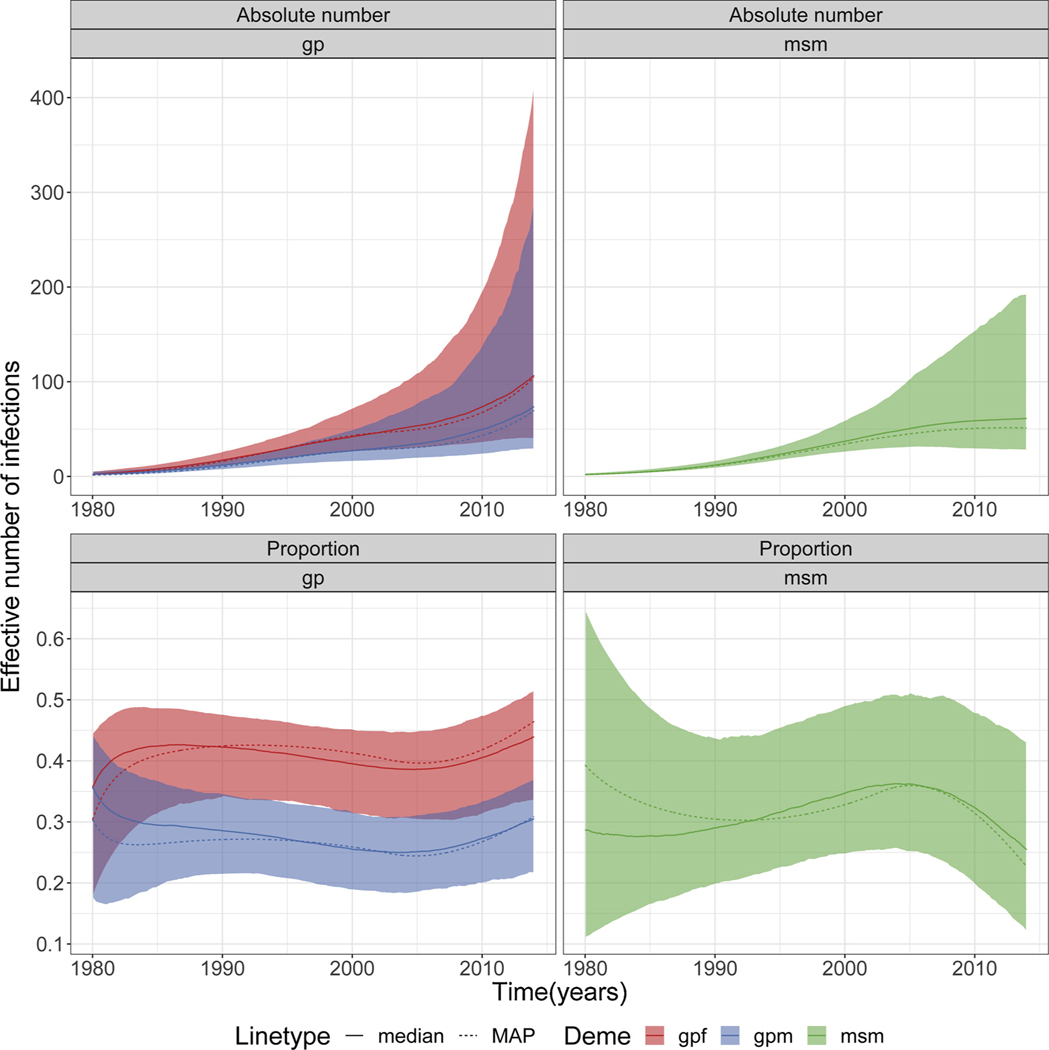
Fig. 2.
Effective number/proportion of infections in risk groups for subtype C. Plots showing the absolute number and proportion of the effective number of infections in each deme/group (gpf, gpm and msm) for the individual analyses for subtype C. Shaded area represents the 95% credible interval. MAP = maximum a posteriori.

