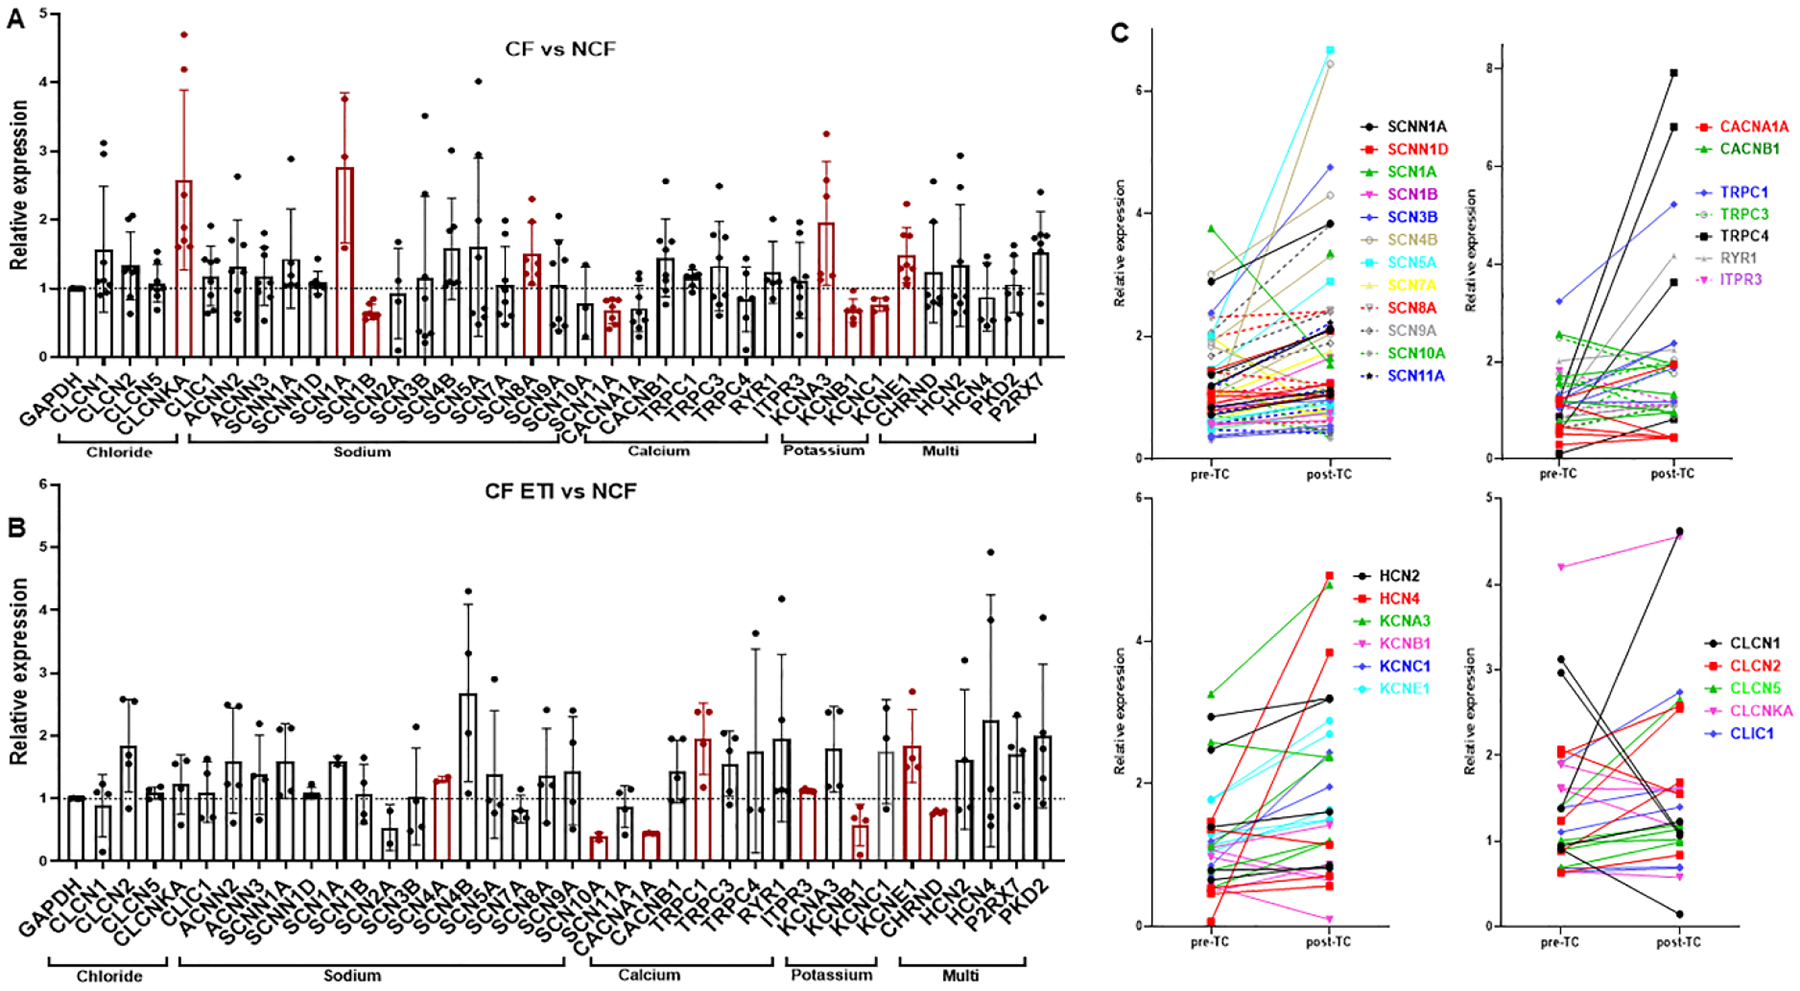
Figure 3: Taqman custom microarray ion channel relative expression ratios.

for A) CF/Non-CF MDMs at baseline and B) CF MDMs treated with ETI compared to non-CF. All values were normalized to GAPDH, n=5=8 per group, mean ± SD shown. Some channels were not expressed in all patient samples. Statistically significant comparisons via Brown-Forsythe and Welch ANOVA are displayed in red color. C) Paired changes in relative expression ratios from A & B (PWCF only) pre- and post-ETI with groupings of channels by ion type. Color coding represents individuals for each specific channel.
