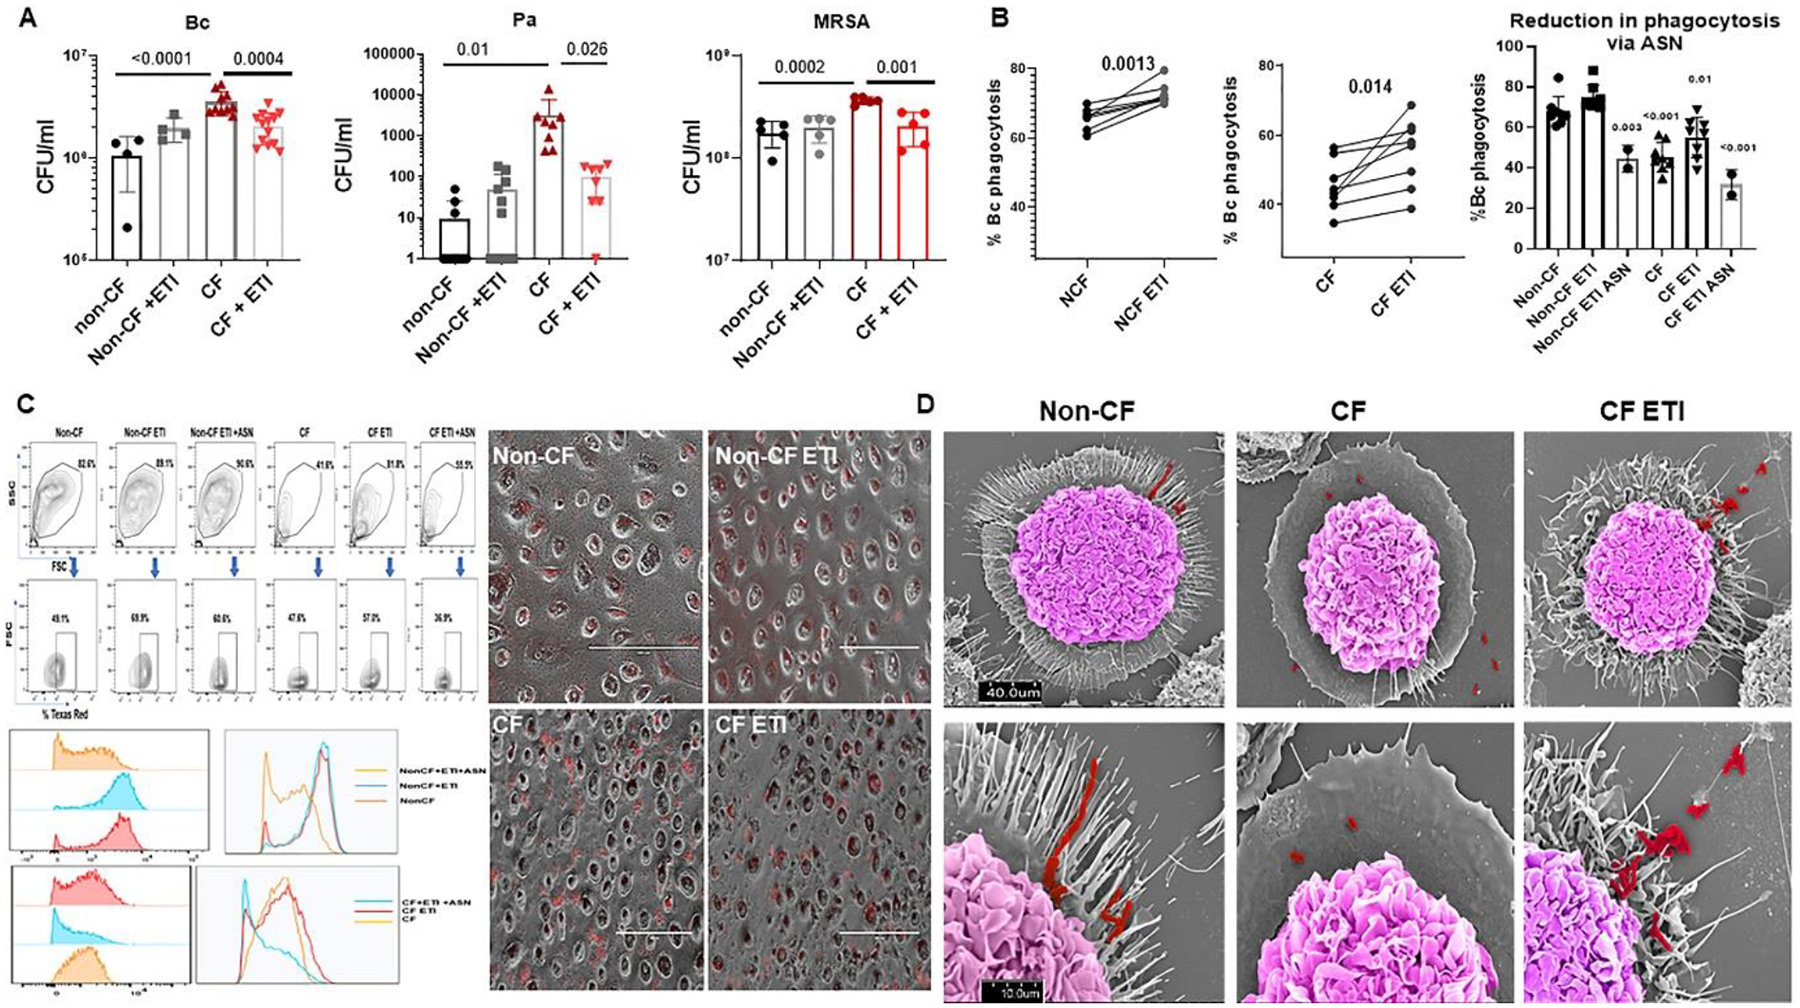
Figure 5: ETI improves bacterial phagocytosis and intracellular killing.

A) Colony-forming unit (CFU) assay for non-CF and CF MDMs ± ETI treatment during overnight infection with B. cenocepacia k56–2 isolate (Bc) or CF clinical isolates of P. aeruginosa and MRSA. Log scale, n=4–13 donors, mean ± SD. P values for individual comparisons shown, via one-way ANOVA. B) Paired and summed % phagocytosis of RFP-expressing B. cenocepacia in non-CF and CF MDMs ± ETI or ETI plus airway supernatant (ASN) treatment. n = 2–8/group, MOI 50, mean ±SD, p values via paired t-test or one-way ANOVA. C) Representative flow cytometry gating strategy, histogram, and light microscopy for bacterial phagocytosis from 5B. FACS gating on forward scatter (FSC), side scatter (SSC), and detection of Bc expressing Texas Red. D) SEM images of non-CF, CF, and CF ETI MDMs during infection with Bc. Non-CF ETI not shown. Scale bars displayed, top images with magnification 5.0kV 8.00mm × 1.3k SE (U) and bottom images with 5.0kV 8mm x4.00k SE(U). Bacteria are pseudocolored red and macrophages pseudocolored purple.
