
Figure 8: Clinical outcome changes post-ETI.
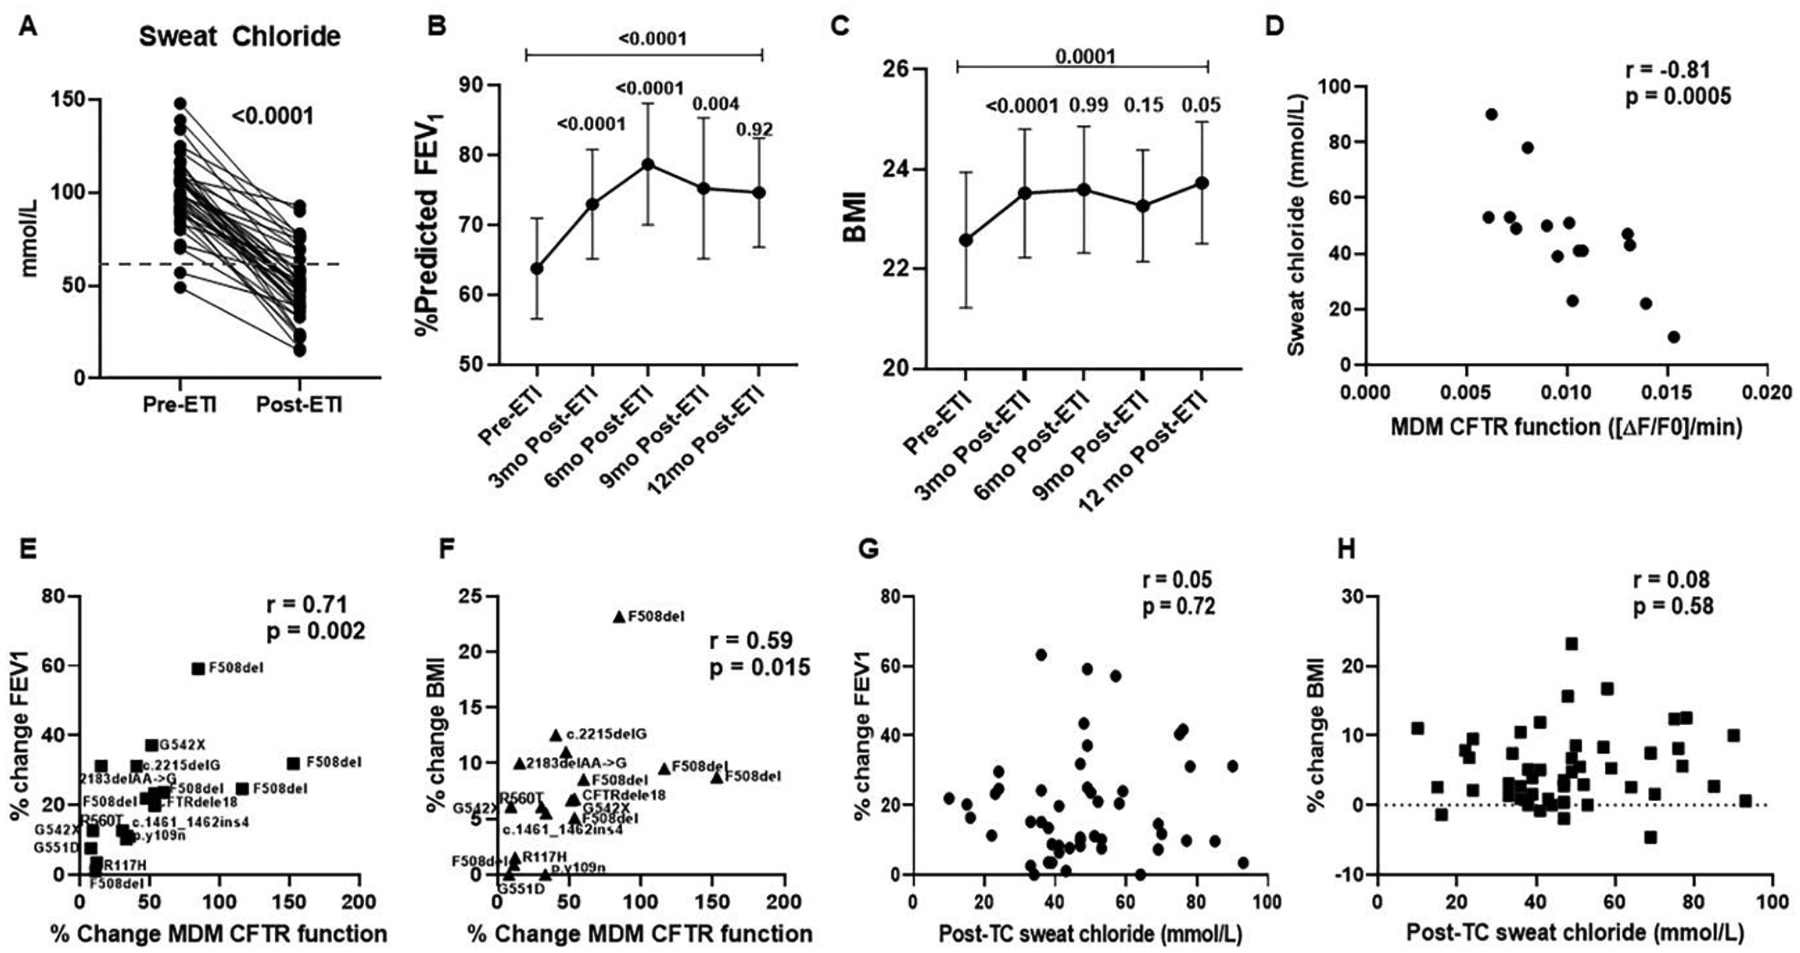
A) Changes in sweat chloride for PWCF pre- and 1-month post-ETI initiation. N=52, p <0.0001 via paired t-test. Dashed line represents the clinical threshold of 60mmol/L for a positive sweat chloride test. B) Changes in percent predicted FEV1 over 12 months for PWCF. Shown are mean values plus 95% CI at baseline (pre-ETI), 3-, 6-, 9-, and 12-months post-ETI initiation. All individuals had at least 3 months of data. P values shown for comparisons between time points, via linear mixed effects model with post-hoc comparisons between neighboring visits, as well as between baseline and 12-month using the Sidak method. C) Changes in BMI over 12 months for PWCF. Shown are mean values plus 95% CI at baseline (pre-ETI), 3-, 6-, 9-, and 12-months post-ETI initiation. All individuals had at least 3 months of data. P values shown for comparisons between time points, via linear mixed effects model with post-hoc comparisons between neighboring visits, as well as between baseline and 12-month using the Sidak method. D) Correlation plot for sweat chloride and maximal MDM CFTR function for PWCF, n=15. A significant negative correlation was observed (Spearman’s r= −0.81, p = 0.0005). E) Correlation plot for 3-month post-ETI FEV1 and change in MDM CFTR function pre- and post-ETI treatment for PWCF, n=17. A significant positive correlation was observed (Spearman’s r = 0.71, p = 0.002). The second CFTR variant is overlayed on each sample. All individuals with at least one copy of F508del. F) Correlation plot for 3-month post-ETI BMI and change in MDM CFTR function pre- and post-ETI treatment for PWCF, n=17. A significant positive correlation was observed (r = 0.59, p = 0.015). The second CFTR variant is overlayed on each sample. All individuals with at least one copy of F508del. G) Correlation plot for 3-month post-ETI FEV1 and sweat chloride for PWCF, n=49. No correlation was observed (r = 0.05, p = 0.72). H) Correlation plot for 3-month post-ETI BMI and sweat chloride for PWCF, n=49. No correlation was observed (r = 0.08, p = 0.58).