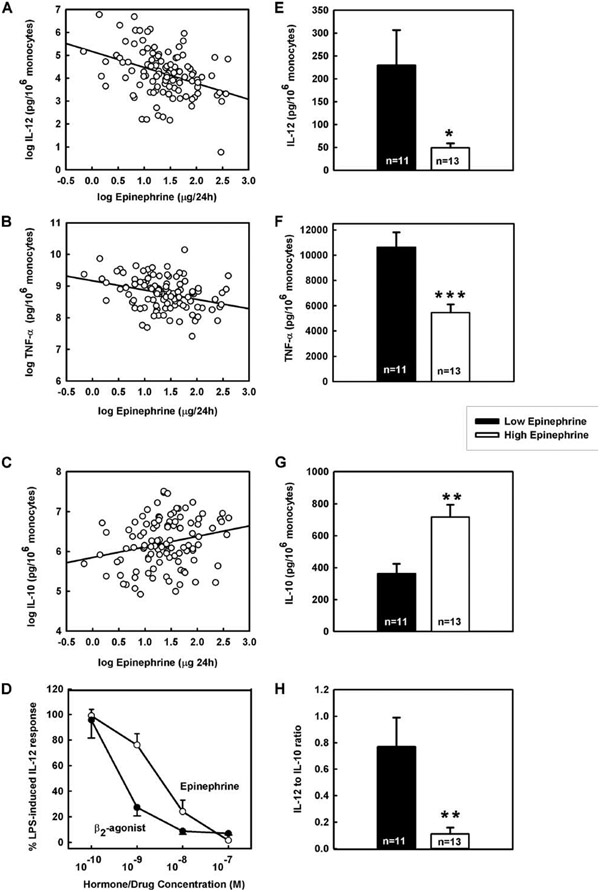
FIGURE 3.
Correlations between cytokines ex vivo and baseline EPI output in vivo in 107 healthy human subjects. A, Plot of IL-12 vs 24-h EPI excretion. B, Plot of TNF-α vs 24-h EPI excretion. C, Plot of IL-10 vs 24-h EPI excretion. D, Dose-dependent inhibitory effect of EPI and fenoterol on human IL-12 production in whole blood cultures. Ex vivo IL-12 (E), TNF-α (F), IL-10 (G), and IL-12:IL-10 ratio (H) in low (≤1.94 μg/24 h) vs high EPI excretors (≥7.19 μg/24 h). Low vs high EPI excretors were estimated by subtracting and adding 1 SD from the means of the population estimates of 24-h urinary EPI excretion. Data are expressed as means ± SE. ***, **, and * designate significance at p < 0.001, 0.0,1 and 0.05, respectively. Cytokine production was corrected for monocyte number and expressed as pg/106 monocytes. The means of the urinary EPI excretion (μg/24 h ± SD) in low and high EPI excretors were 1.49 ± 0.34 and 10.13 ± 2.21, respectively. The means ± SD of the monocyte percentages and absolute monocyte count in low vs high EPI excretors were 7.39 ± 1.85% and 0.41 ± 0.14 × 10³/μl vs 7.44 ± 1.56% and 0.47 ± 0.12 × 10³/μl, respectively. The means of the population estimates for monocyte percentages and absolute monocyte count were 7.73% and 0.43 × 10³/μl. The means of the population estimates for 24-h urinary EPI excretion, the ex vivo IL-12, TNF-α, and IL-10 production and IL-12: IL-10 ratio were 4.57 μg/24 h, 113, 7243, and 595 pg/106 monocytes and 0.37, respectively.

