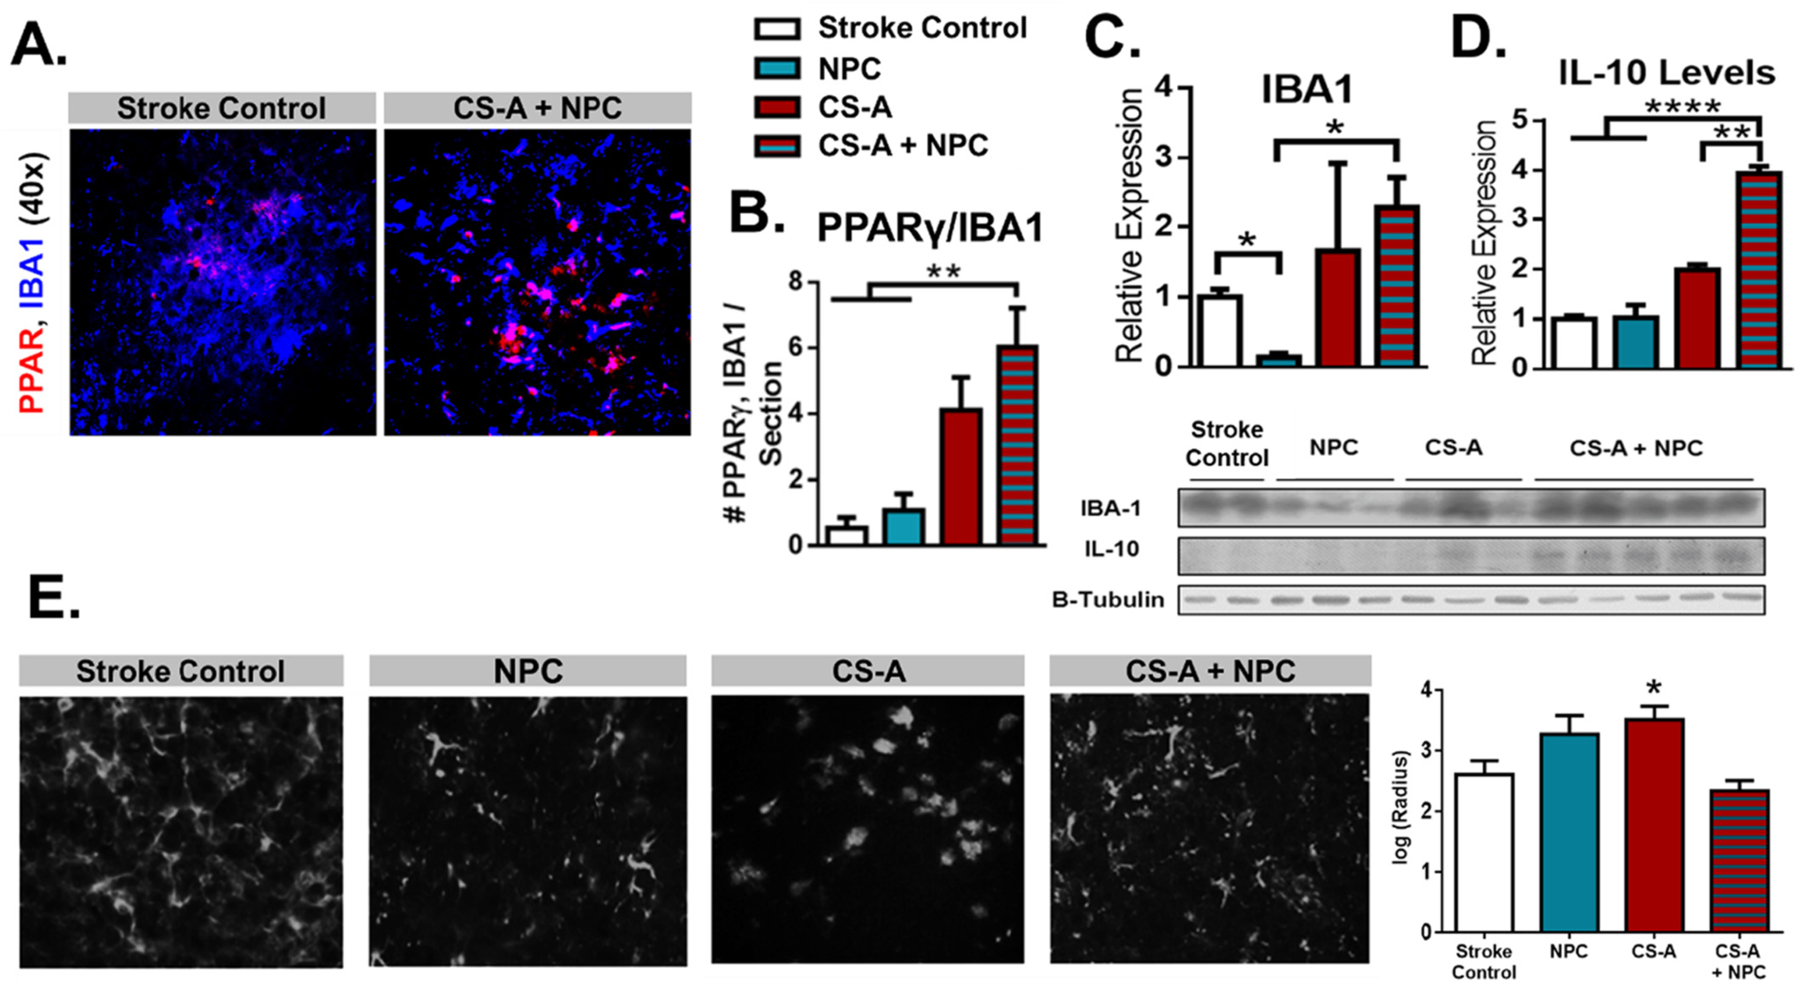
Fig. 2.

CS-A + NPCs Increases PPARγ Macrophages and IL-10 Expression. A. Representative images of PPARγ and IBA1 co-staining in the stroke area 2 weeks after transplantation. B. Analysis of number of PPARγ/IBA1 co-staining. n = 8–12. **indicates p < 0.005; 1-way ANOVA. C-D. Western blot analyses of IBA1 (C) and IL-10 (D) expression in the stroke area 1 week after transplantation. E. Microglia radius derived from Sholl analysis indicated significant increase in cell size in CS-A treated animals but not in NPC or CS-A + NPC treated groups. n = 4–8. *, **, and **** indicate p < 0.05, p < 0.005, and p < 0.0001, respectively; 1-way ANOVA with Bonferroni correction.
