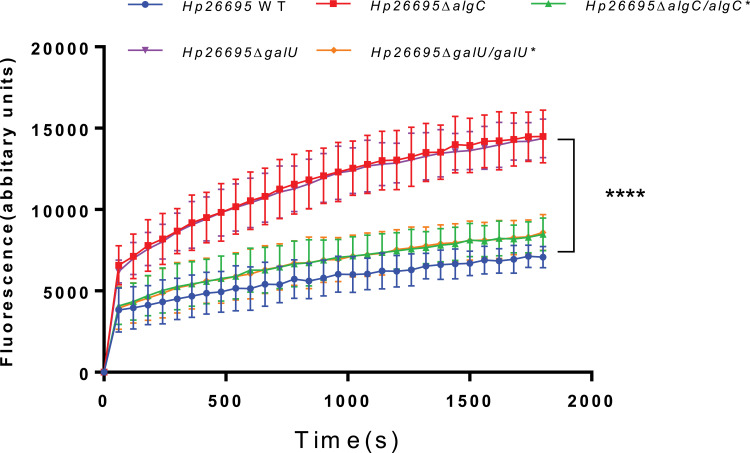
Figure 4.
Comparison of EB accumulation in various types of H. pylori strains. The fluorescence intensity was recorded at excitation and emission wavelengths of 545 and 590 nm, respectively, over a 30-min incubation period. The data represents the mean ± SEM of three independent experiments. A paired Student’s t test was performed for comparing the EB accumulation between the WT and gene knockout strains (ΔalgC and ΔgalU). ****P<0.0001.

