
Figure B2. Scatter Plots Showing Percent Accuracy for Real (Top Row) and Fake (Bottom) News Articles Across Levels of Analytical Reasoning (Continuous; Indexed by the CRT Scores) and Across Chronological Age (Continuous) Within the Older Adult Sample in the Non-COVID (Left) and COVID (Right) Conditions.
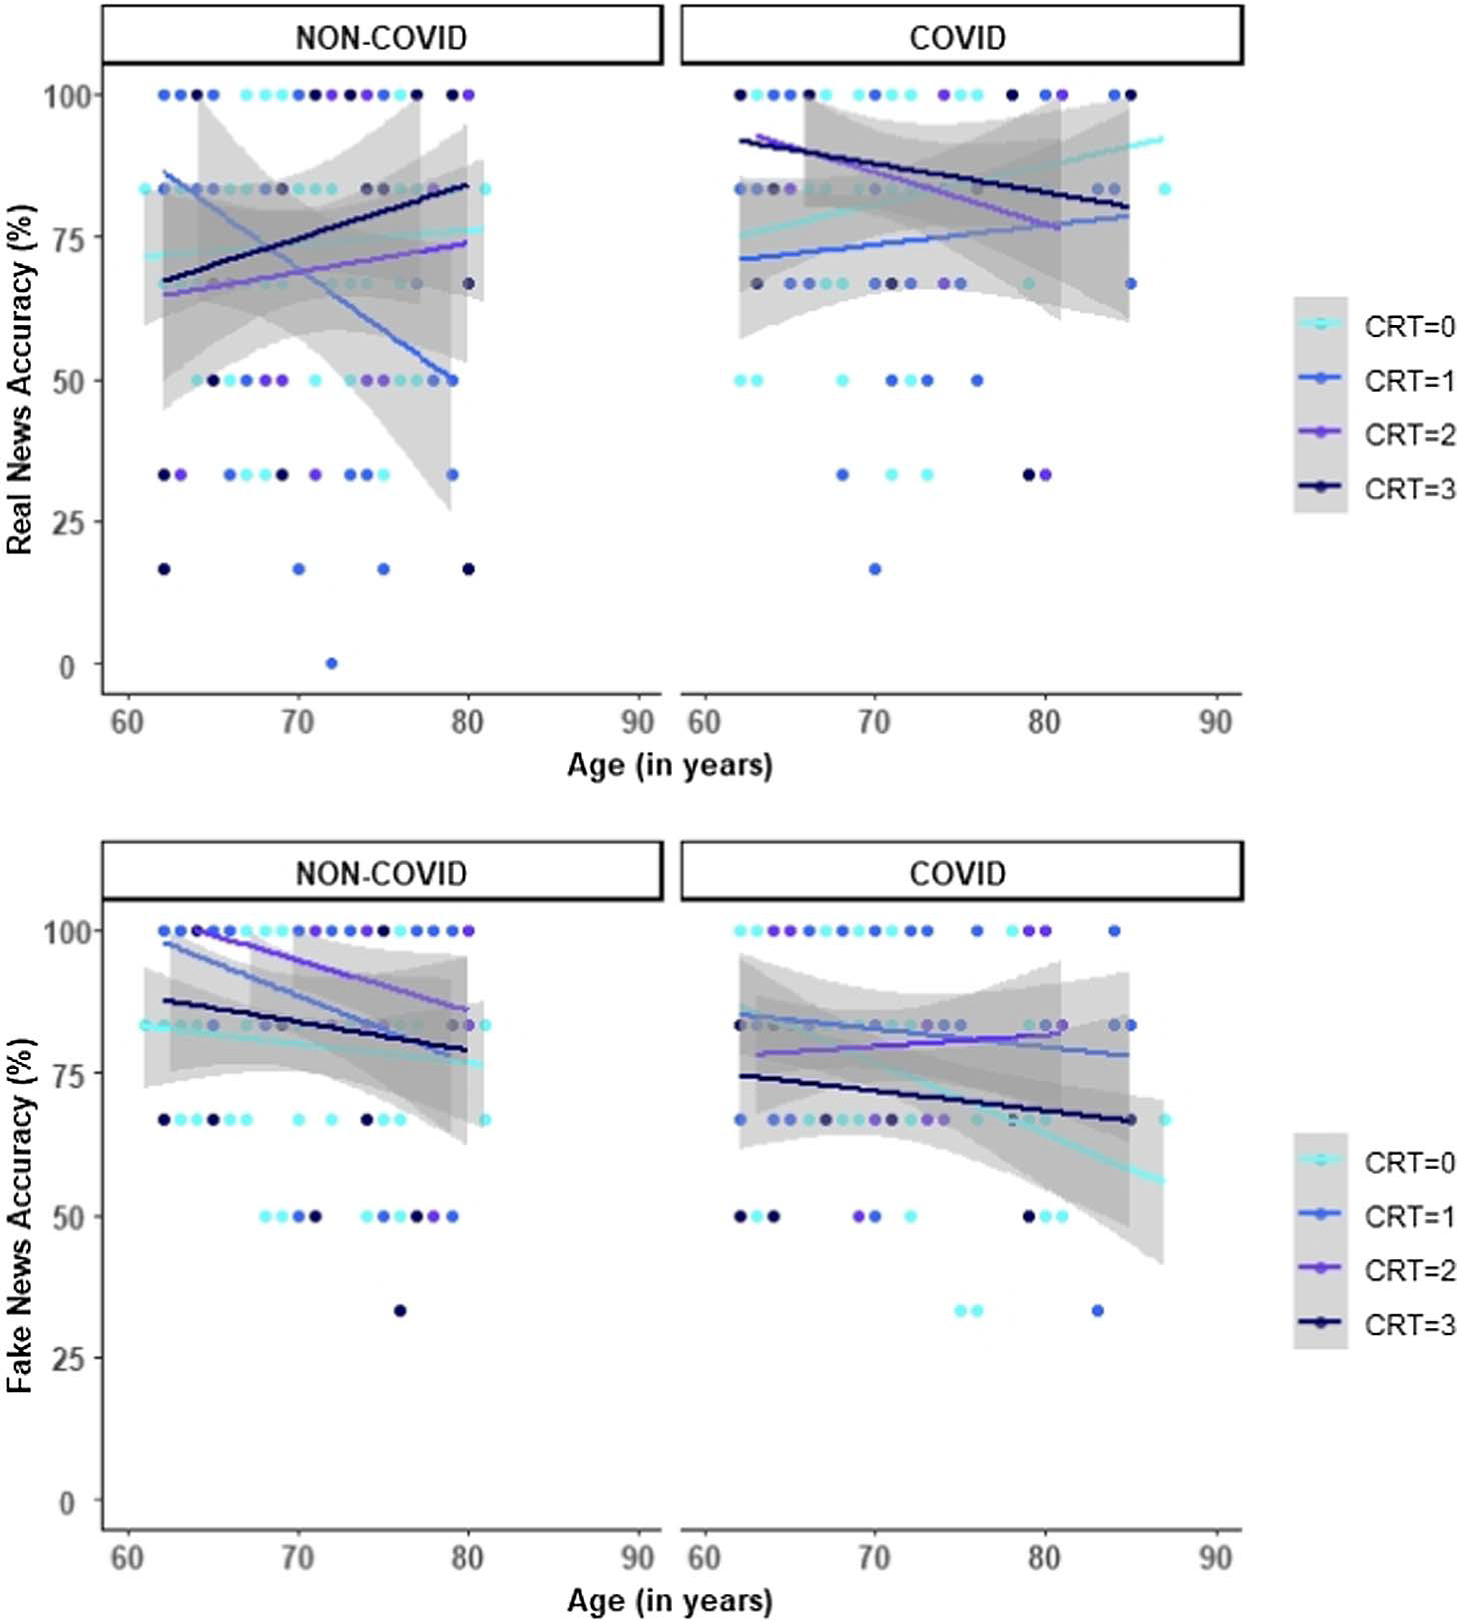
Note. CRT = Cognitive Reflection Test. Gray shaded areas reflect standard errors for accuracy across CRT scores.