
Figure B4. Scatter Plots Showing Percent Accuracy for Real (Left) and Fake (Right) News Articles Across Levels of NCF (Continuous) and Across Chronological Age (Continuous) Within the Older Adult Sample.
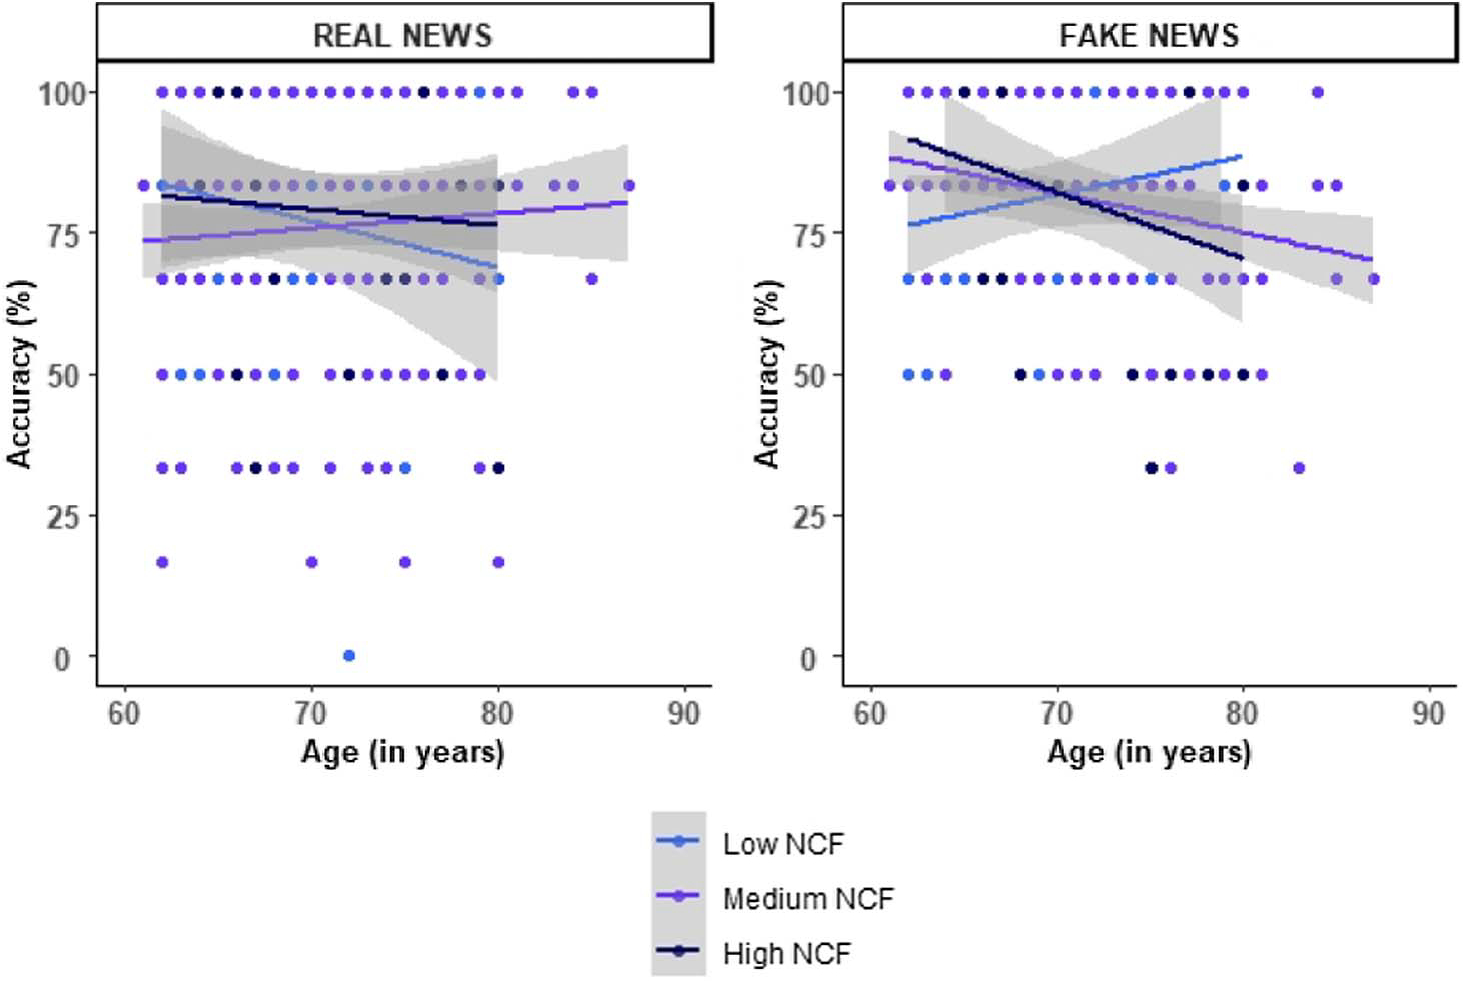
Note. NCF = news consumption frequency. The medium NCF level indicates the mean NCF score in the sample while the low and high levels indicate 1 SD below and above the mean NCF score, respectively. Gray shaded areas reflect standard errors for accuracy across NCF scores.