
Figure 1.
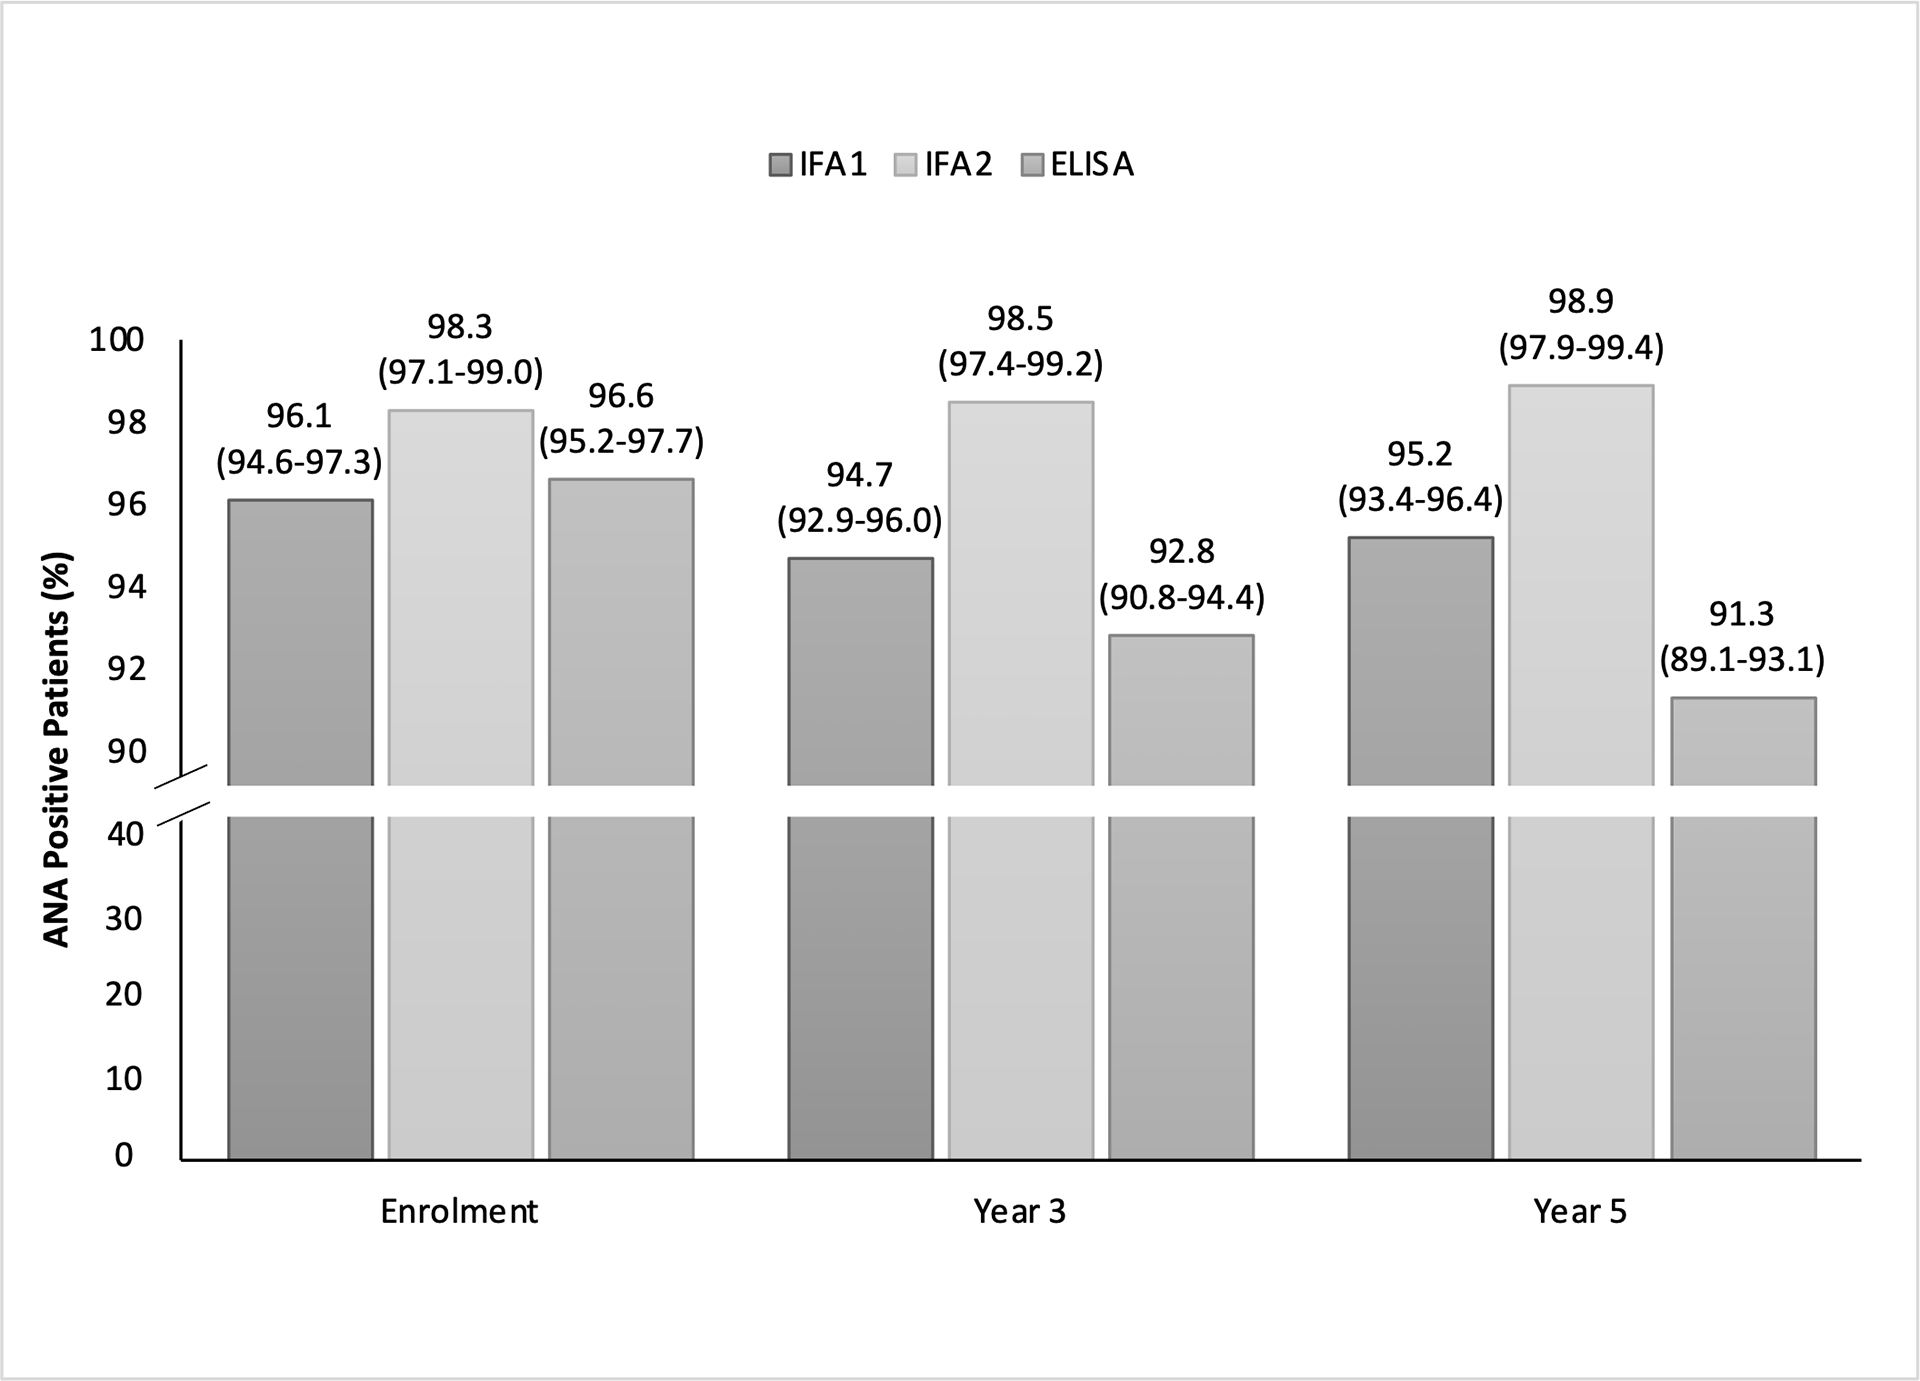
ANA positivity among IFA1 (n=805), IFA2 (n=805) and ELISA (n=805) at enrolment, year 3 and year 5. There is a break in the y-axis between 40% and 90% to enhance the readability of the graph from 90-100%.
Official websites use .gov
A
.gov website belongs to an official
government organization in the United States.
Secure .gov websites use HTTPS
A lock (
) or https:// means you've safely
connected to the .gov website. Share sensitive
information only on official, secure websites.
ANA positivity among IFA1 (n=805), IFA2 (n=805) and ELISA (n=805) at enrolment, year 3 and year 5. There is a break in the y-axis between 40% and 90% to enhance the readability of the graph from 90-100%.