
Figure 2.
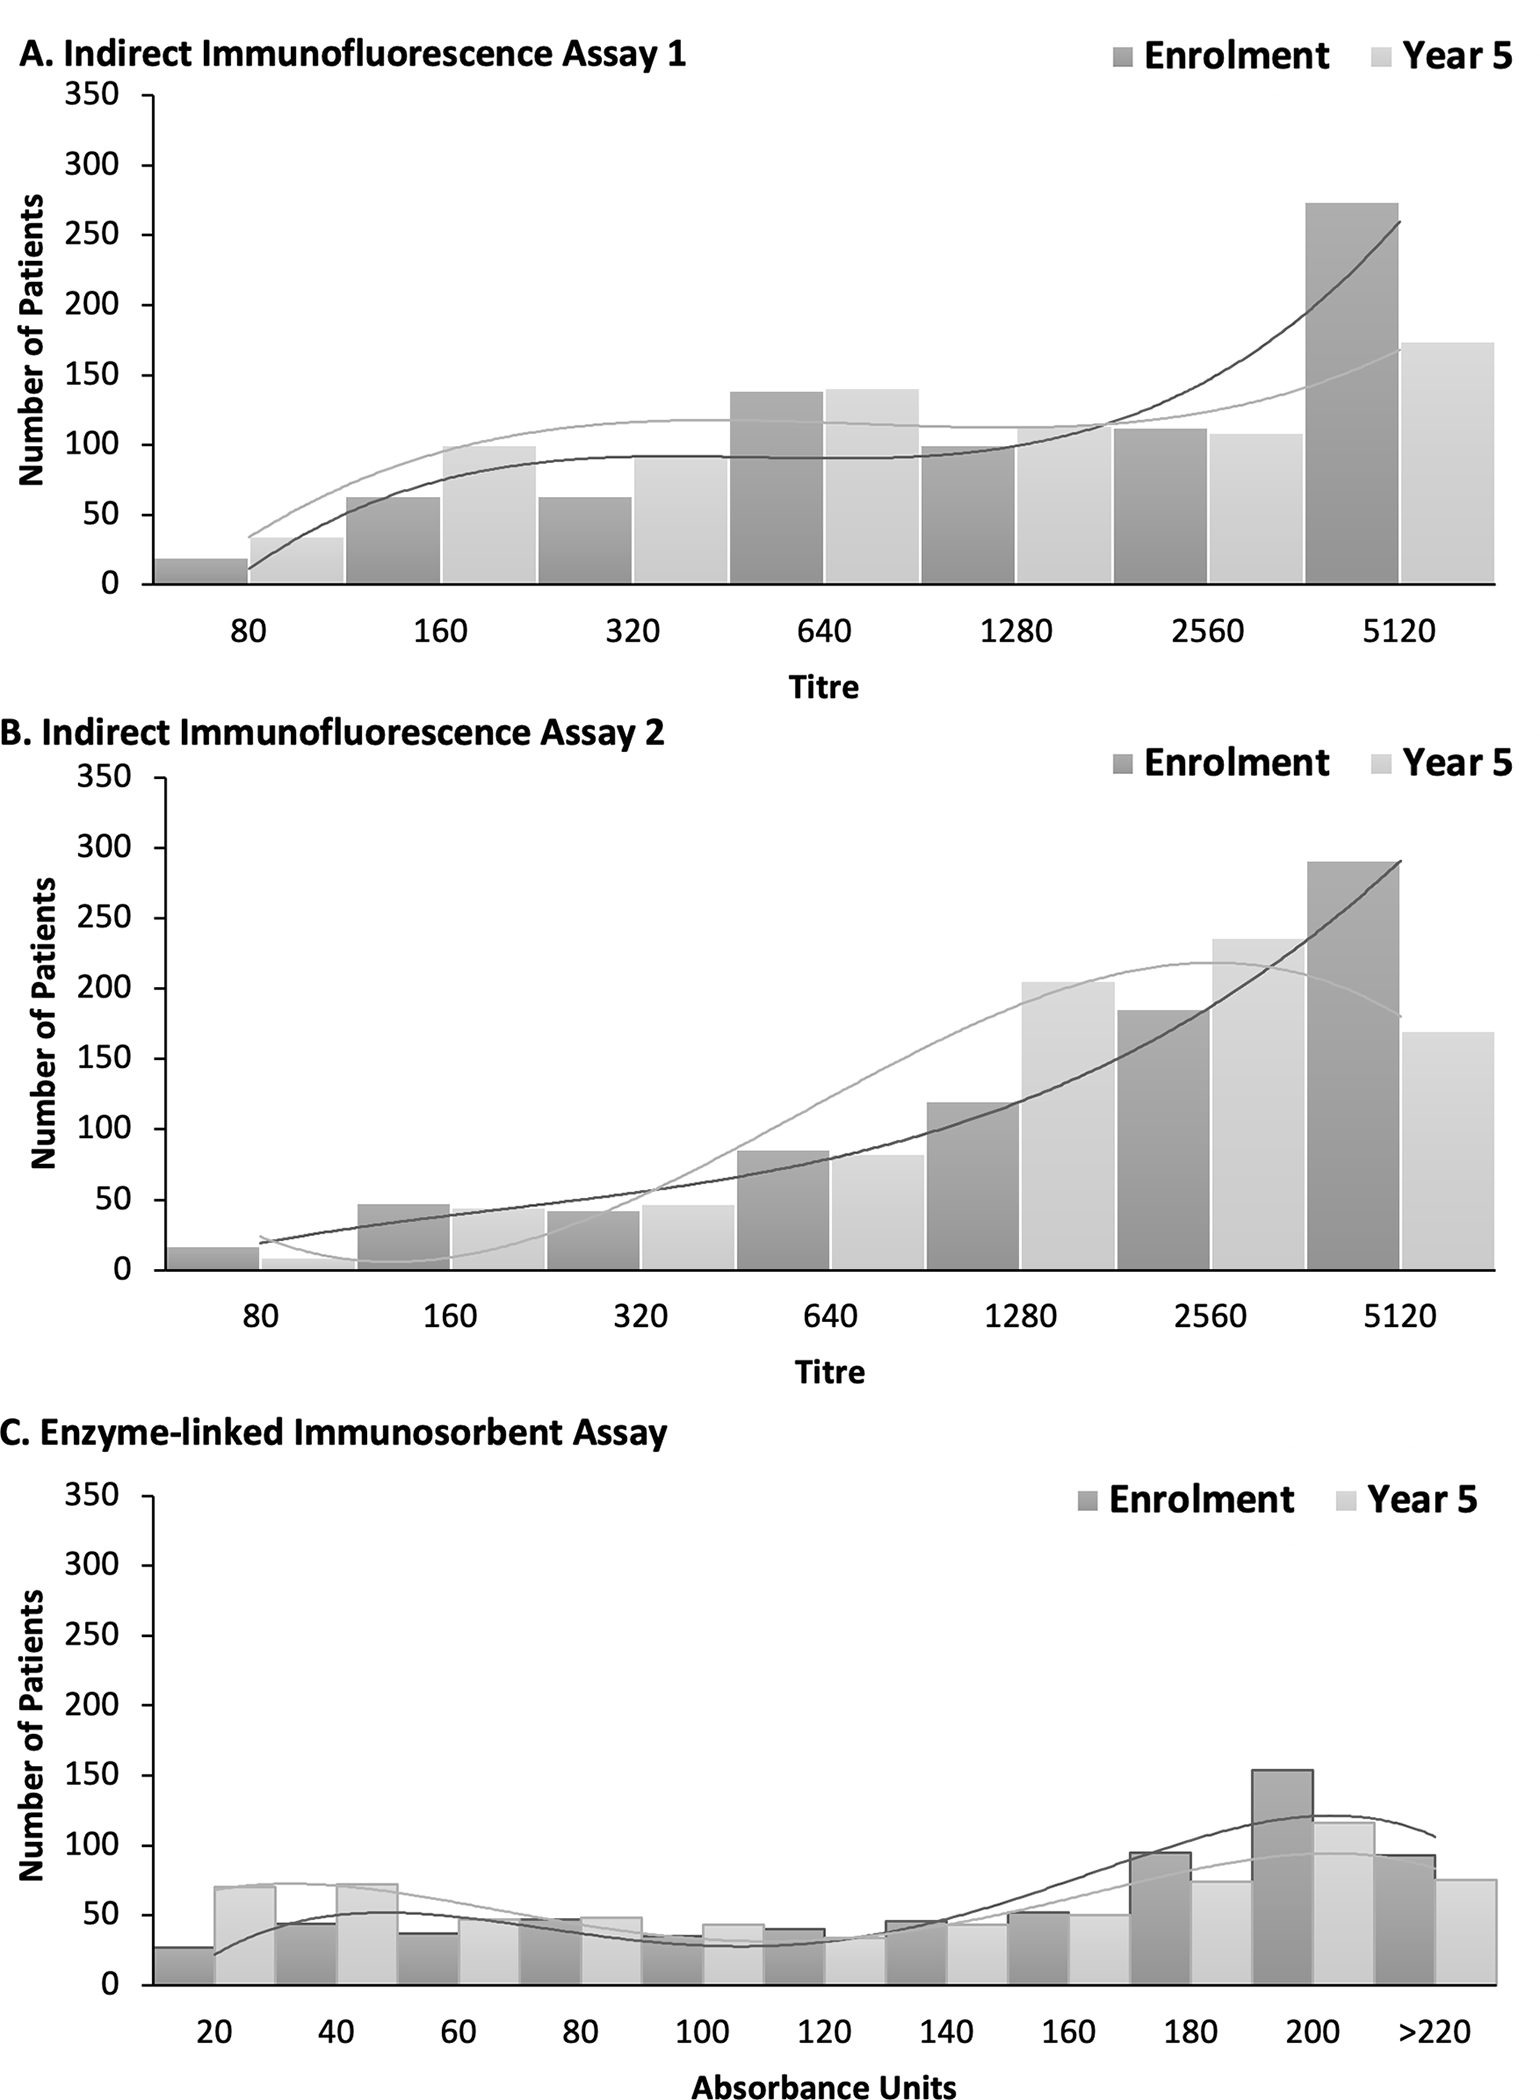
Distribution of ANA titres at enrolment and year 5 visit for A) indirect immunofluorescence 1 (IFA1) (n=805), B) IFA2 (n=805) and C) enzyme-linked immunosorbent assay (ELISA) (n=805). Lines represent the curve of best fit.
Official websites use .gov
A
.gov website belongs to an official
government organization in the United States.
Secure .gov websites use HTTPS
A lock (
) or https:// means you've safely
connected to the .gov website. Share sensitive
information only on official, secure websites.
Distribution of ANA titres at enrolment and year 5 visit for A) indirect immunofluorescence 1 (IFA1) (n=805), B) IFA2 (n=805) and C) enzyme-linked immunosorbent assay (ELISA) (n=805). Lines represent the curve of best fit.