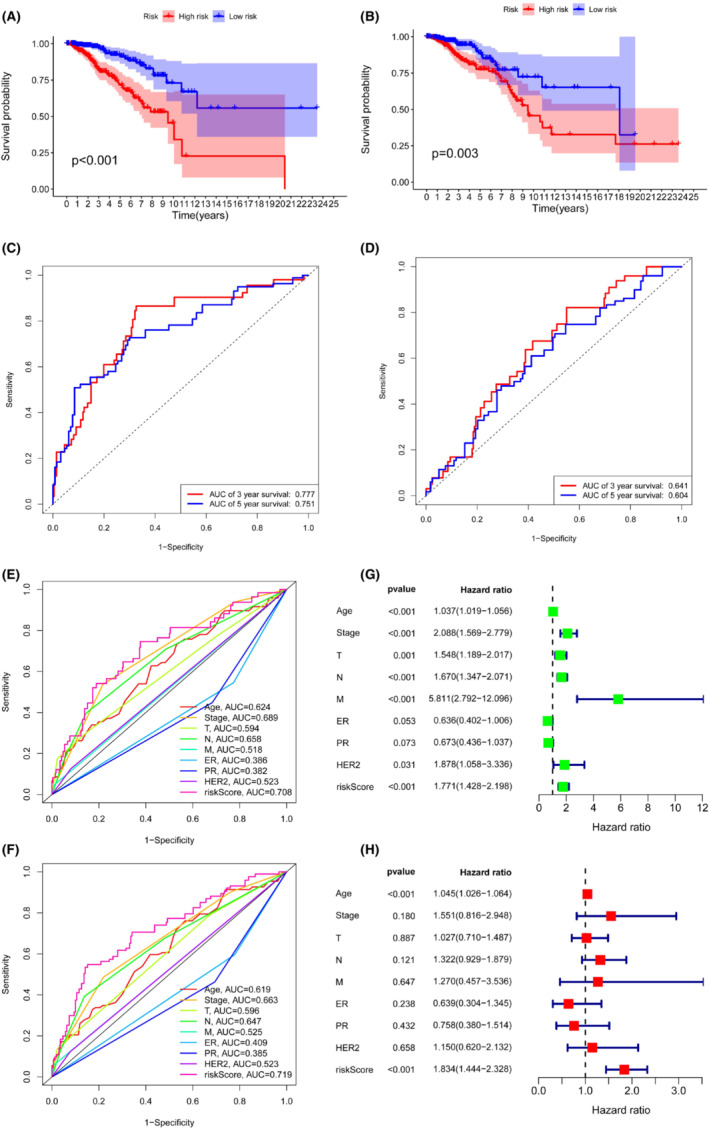
FIGURE 3.

Performance and validation of the prognostic risk model: (A) Kaplan–Meier analysis of the training group. (B) Kaplan–Meier analysis of the testing group. (C) The ROC curve of overall survival for the training group. (D) The ROC curve of overall survival for the testing group. (E) Multivariate ROC analysis at 3 years. (F) Multivariate ROC analysis at 5 years. (G, H) Univariate and multivariate Cox regression analysis of clinical characteristics and risk scores.
