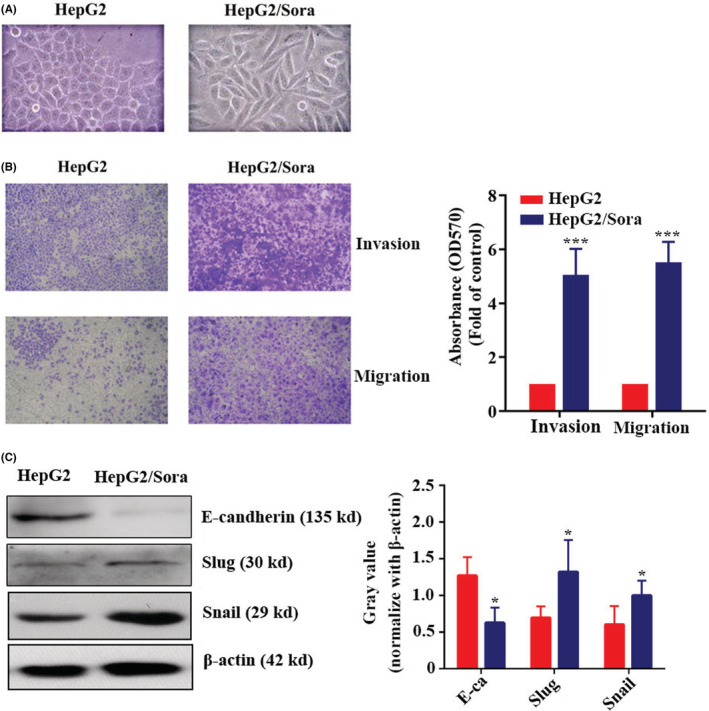
FIGURE 2.

The invasion and migration of HepG2 cells were enhanced after sorafenib resistance. (A) Morphology of HepG2 or HepG2/Sora cells under the microscope (200× magnification). Transwell migration assay. Representative images (left) and quantification (right) of HepG2 or HepG2/Sora cell migration. HepG2 groups vs. HepG2/Sora groups, ***p < 0.001. (C) Western blot analysis of E‐cadherin, Slug, Snail and β‐Actin expression levels in HepG2 and HepG2/Sora cells (left). Relative gray values of E‐cadherin, Slug and Snail according to western blotting (right). HepG2 groups vs. HepG2/Sora groups, *p < 0.05.
