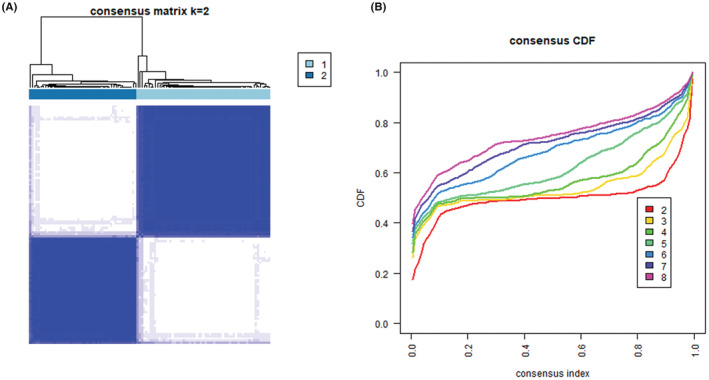
FIGURE 3.

Consensus clustering of cohort 2 patients. The results of consensus clustering analysis are shown. (A) Consensus matrix plots when the maximum number of clusters (K) is set to two. (B) Empirical cumulative distribution function plots when the maximum number of clusters (k) is increased from two to eight.
