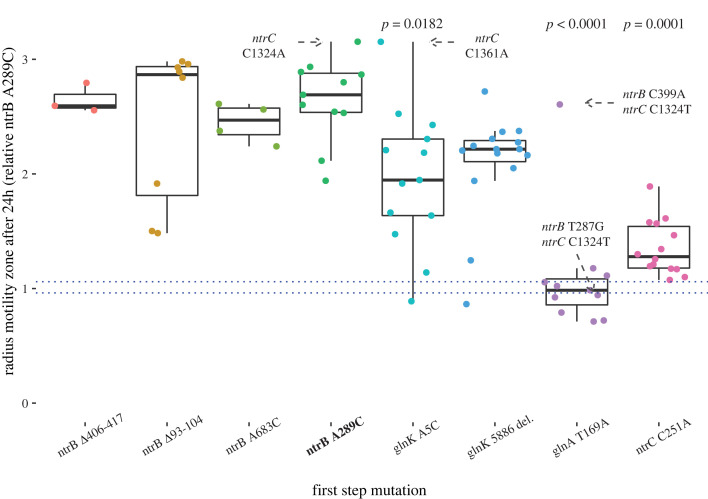
Figure 3.
Motile lineages descended from hotspot mutation ntrB A289C offer equivalent or superior motility phenotypes compared to alternative mutational routes. Motile first-step ancestors are shown on the x-axis, with the hotspot mutation highlighted in bold. The radius of the motility zones, relative to hotspot mutation ntrB A289C first-step mutation, for the spectrum of descendants is shown on the y-axis. Each point represents the median phenotypic value of at least three technical replicates for each isolated descendent (mean range = 0.17; technical repeat data available in electronic supplementary material, Data, table S1). Boxes display the median, and first to third interquartile range (IQR) for the median phenotypic values. Whiskers show outside values up to 1.5 x IQR. First and third IQR for the ntrB A289C first-step control replicates are denoted by dotted blue lines. The p-values (Dunn test) for descendent populations with significantly different distributions of motility relative to ntrB A289C descendants are displayed above the relevant lineages. The strongest second-step genotypes, and the identified triple mutants, are annotated on the figure. Number of replicates (n) for each condition: ntrB A289C n = 11. Alternate ntrB mutations Δ406–417 n = 3, A683C n = 4, Δ93–104 n = 8. glnK A5C n = 13, glnK 5886 del. n = 15. glnA T169A n = 11. ntrC C251A n = 14.

