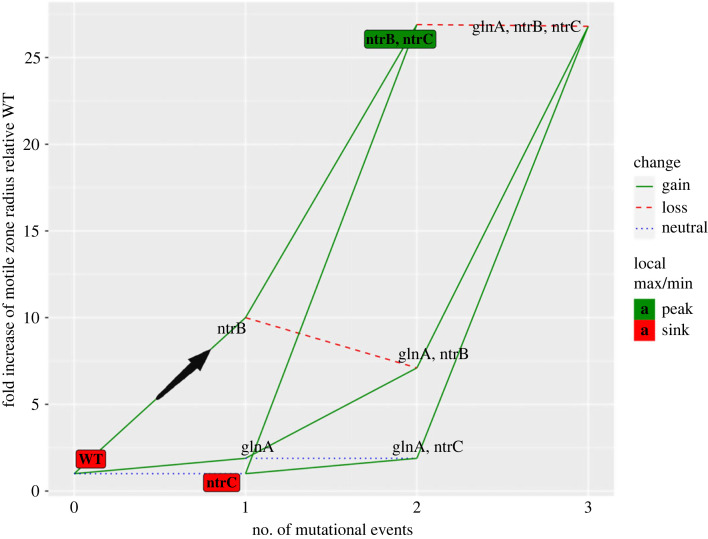
Figure 4.
Following a biased trajectory allows adapting populations to reach the strongest observed phenotype in the fewest mutational steps. A genotype–phenotype landscape detailing phenotypic trajectories based on mutation within three loci: the hotspot-harbouring locus ntrB, glnA and ntrC (helix-turn-helix encoding domain). The point where two lines meet denotes a mutant genotype (the annotation) and its associated phenotypic strength (y-axis position) after a given number of mutational events from the ancestral AR2 genotype (x-axis position). Edges connecting the annotations represent genotypes connected by one mutational event. The biased mutational step is labelled with a black arrow. Unless otherwise stated, motile zone radii (y-axis) are derived from mean radius values for the following mutations: WT (ancestral genotype AR2) = no mutation, zone set to ntrB A289C radius/10 (immotile cells following 24 h growth on soft agar form colony with a small radius). ntrB = A289C. glnA = T169A. ntrC = helix-turn-helix first-step mutation not observed in this study or previous works [11,19,20] so inferred neutral, set equivalent phenotype to WT. ntrB, ntrC = A289C, median value of all A289C descended ntrC phenotypes. glnA, ntrB = T169A, Δ410-421. glnA, ntrC = ntrC inferred neutral, set equivalent phenotype to glnA T169A. glnA, ntrB, ntrC = T169A, C399A, C1324T (strongest observed glnA descendent phenotype shown).

