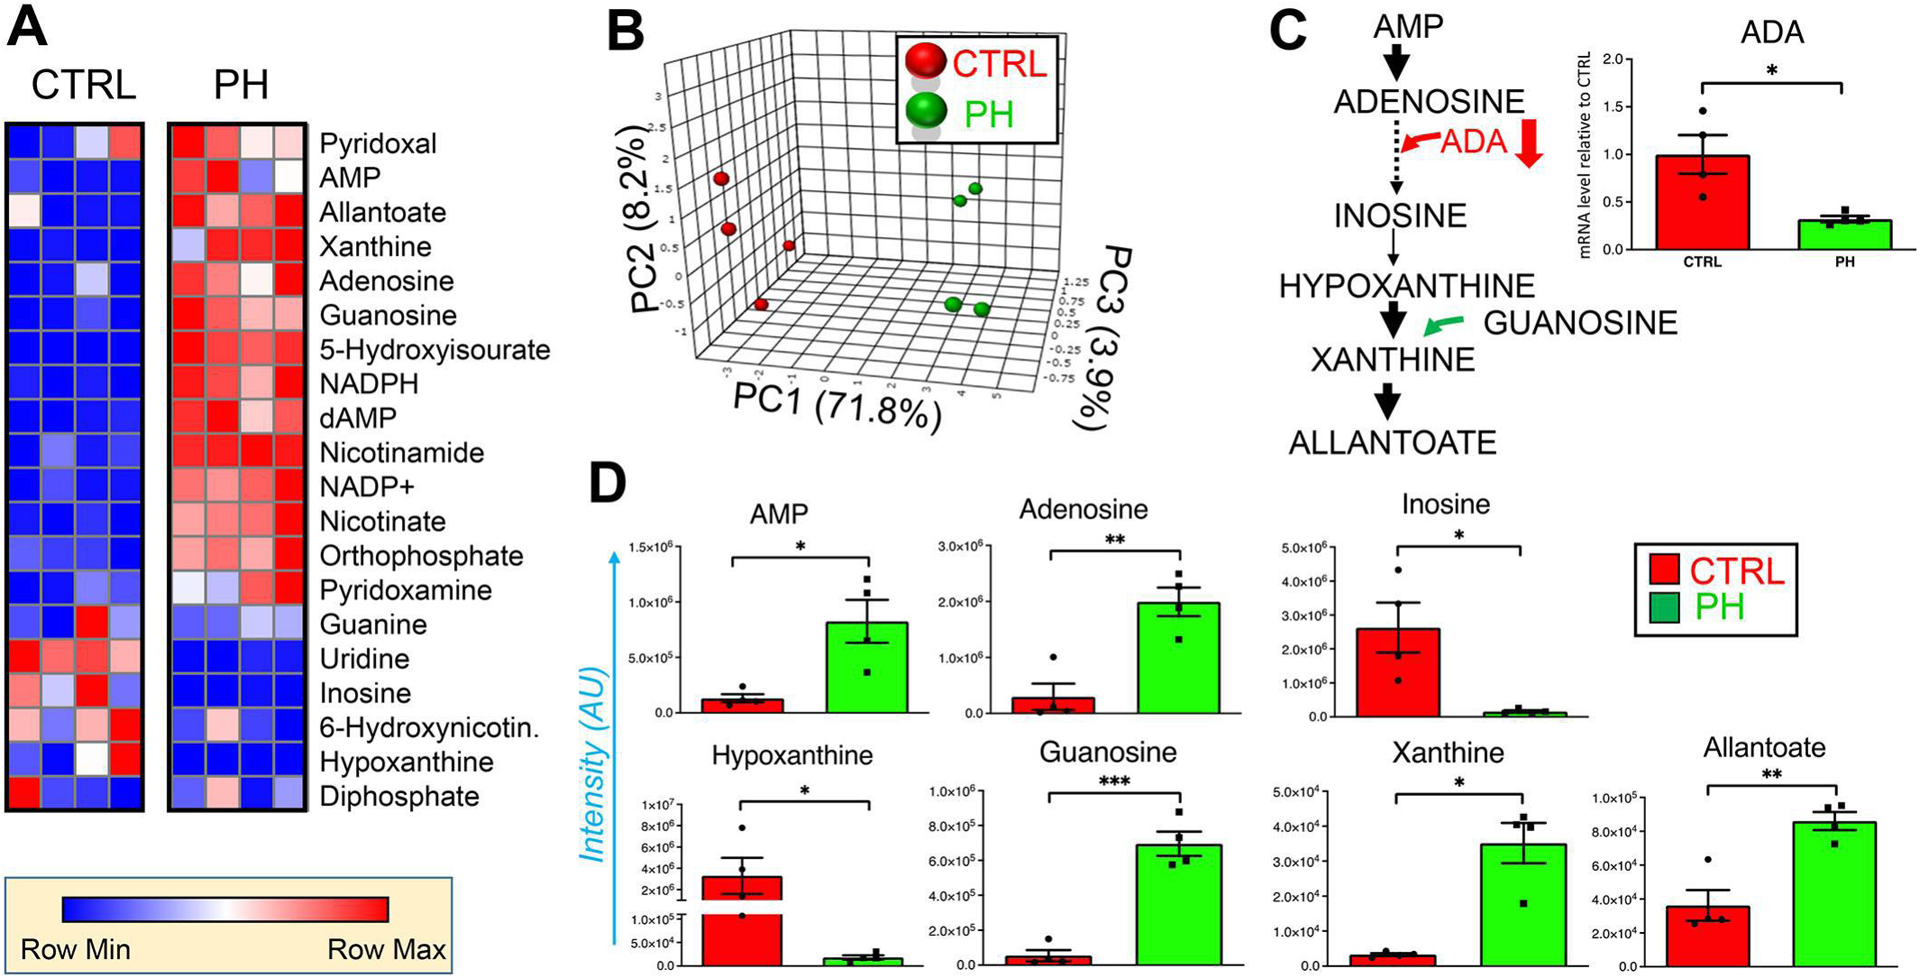
Figure 3. PH-Fibs exhibit upregulation of purine metabolism.

Deranged purine metabolism in fibroblasts derived from the pulmonary artery of health donors (CTRL) and PH patients (PH), as represented by heat maps (blue to red = low to high levels of Z score normalized metabolite abundances, n = 4) in (A). PLS-DA of PH-Fibs is shown in B, based on purine metabolite levels. In C, an overview of purine metabolism and oxidation cascades. Metabolites from this pathway are highlighted in D. (*, **, *** p <0.05, 0.01, 0.001, respectively; n = 4).
