
FIGURE 4.
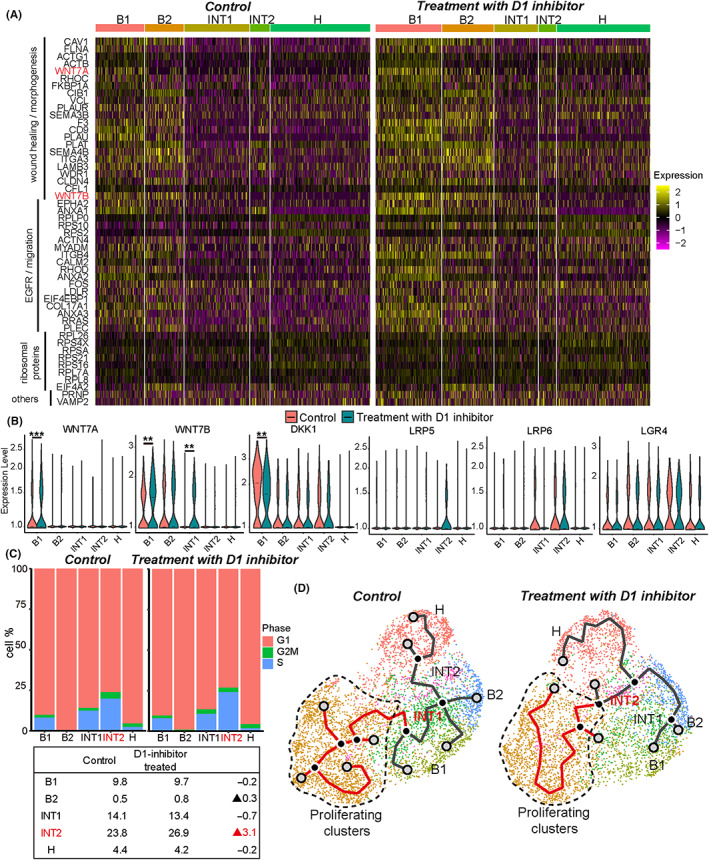
ScRNA‐seq analysis comparing control (DMSO) and D1 inhibitor (SKF‐83566 4 μM) treatment. (A) Heatmap visualization of the 50 most frequently appearing upregulated genes in D1 inhibitor‐treated Sph18‐16 sample by enrichment analysis using all GOBP terms. The details are provided in Table S5. (B) Violin plots depicting the expression of genes compared with control (red) and D1 inhibitor‐treated sample (green). Bar indicates the median value. Adjusted p‐value for B1 of WNT7A, 0.00058; B1 of WNT7B, 0.0029; INT1 of WNT7B, 0.0013; B1 of DKK1, 0.0018. (C) Proliferating cells of each cluster in control or D1 inhibitor‐treated sample (top). Listed percentages of cells in S and G2/M phases of each cluster (down). (D) Trajectories showing INT1 as the center in DMSO and INT2 in D1 inhibitor treatment