
FIGURE 7.
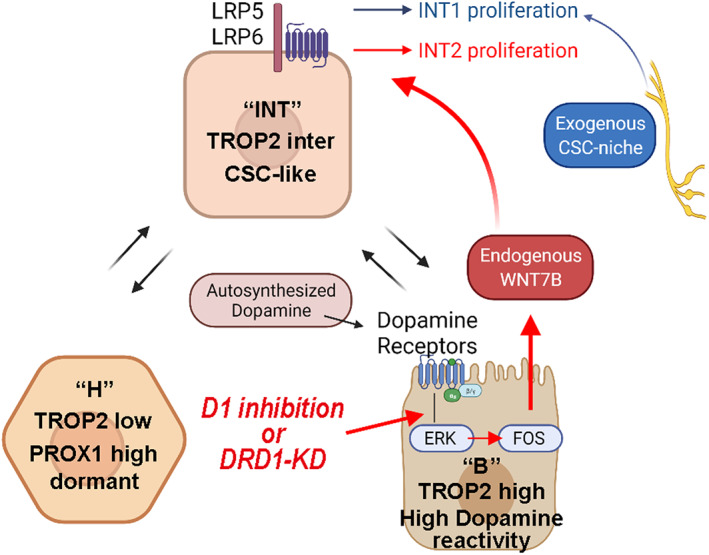
Schematic illustrations depicting variations of B, INT, H clusters, and WNT7B as endogenous cancer stem cell (CSC) niche downstream of DRD1‐ERK‐FOS
Official websites use .gov
A
.gov website belongs to an official
government organization in the United States.
Secure .gov websites use HTTPS
A lock (
) or https:// means you've safely
connected to the .gov website. Share sensitive
information only on official, secure websites.
Schematic illustrations depicting variations of B, INT, H clusters, and WNT7B as endogenous cancer stem cell (CSC) niche downstream of DRD1‐ERK‐FOS