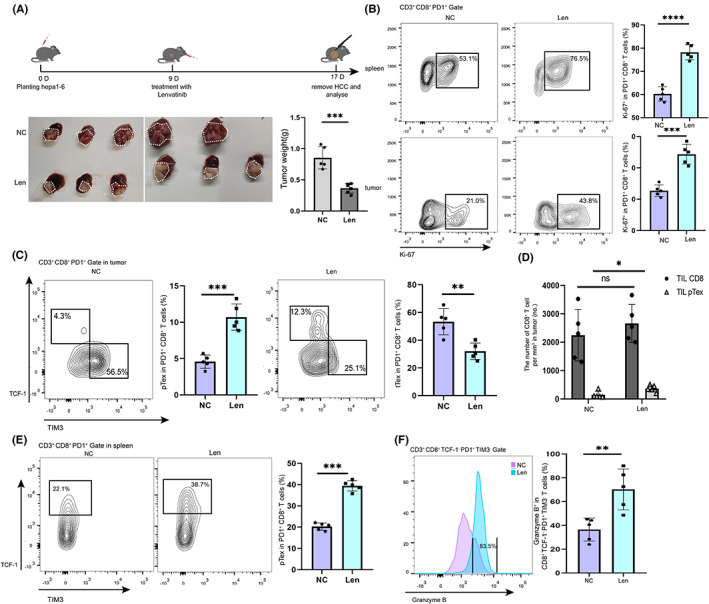
FIGURE 2.

Effects of lenvatinib on infiltration of tcf1+ PD1+ CD8+ T cells in the TME and spleen in mice. A, Schematic of lenvatinib therapy. Hepa1‐6 cells were in situ inoculated into C57BL/6 mice on day 0, lenvatinib was intragastrically administered daily when the tumor volume reached 150 mm3 on day 9, and tumor samples were collected for analysis on days 13 and 17. B, Proliferative activities (marked by expression of Ki‐67) of PD1+ CD8+ T cells from spleen and tumor in the negative control (NC) group and lenvatinib group were analyzed. Data were expressed as mean ± SEM (n = 5). C, Phenotypes of exhausted PD1+ CD8+ T cells (marked by expression of TCF1 and TIM3) from tumor in the NC group and the lenvatinib group were analyzed. Data were expressed as mean ± SEM (n = 5). D, The total number of tumor‐infiltrating CD8+ T cells and the number of pTex cells were detected. Data were expressed as mean ± SEM (n = 5). E, Phenotypes of exhausted PD1+ CD8+ T cells (marked by expression of TCF1 and Ki‐67) from spleen in the NC group and the lenvatinib group were analyzed. Data were expressed as mean ± SEM (n = 5). F, Tumor‐killing functions of intermediate Tex cells (marked by expression of granzyme B) from tumor in the NC group and the lenvatinib group were analyzed. Data were expressed as mean ± SEM (n = 5). *p < 0.05; **p < 0.01; ***p < 0.001, ****p < 0.0001
