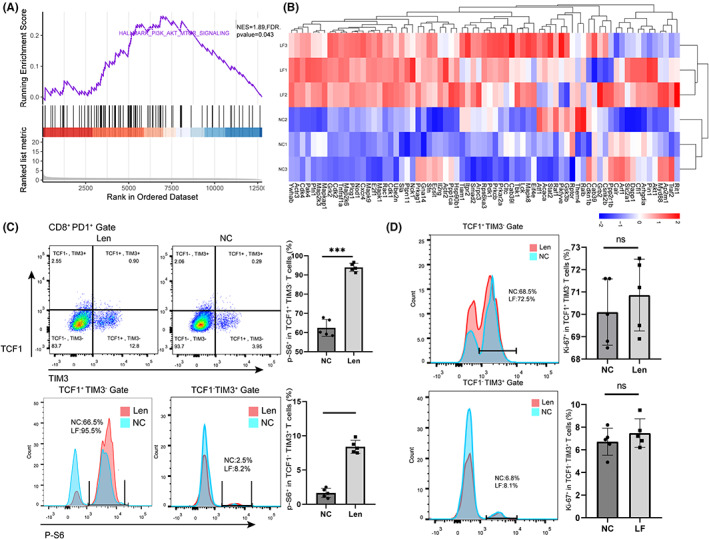
FIGURE 4.

Lenvatinib affects CD8+ T cell differentiation by affecting the PI3K/Akt/mTOR signaling pathway. A, GSEA barcode plot of the mTORC1 pathway in the NC group and the lenvatinib group derived from cultured cells in vitro. B, Heatmap of relative expression (Z score) of the top 50 leading‐edge genes from GSEA of the mTORC1 signaling pathway. C, Phosphorylations of the mTOR pathway (marked by expression of p‐S6) of pTex and tTex cells in the NC group and the lenvatinib group were analyzed. Data were expressed as mean ± SEM (n = 5). D, pTex and tTex cells’ activation status (marked by expression of Ki‐67), in the NC group and lenvatinib group and derived from cultured cells in vitro, was analyzed. Data were expressed as mean ± SEM (n = 5). *p < 0.05; **p < 0.01
