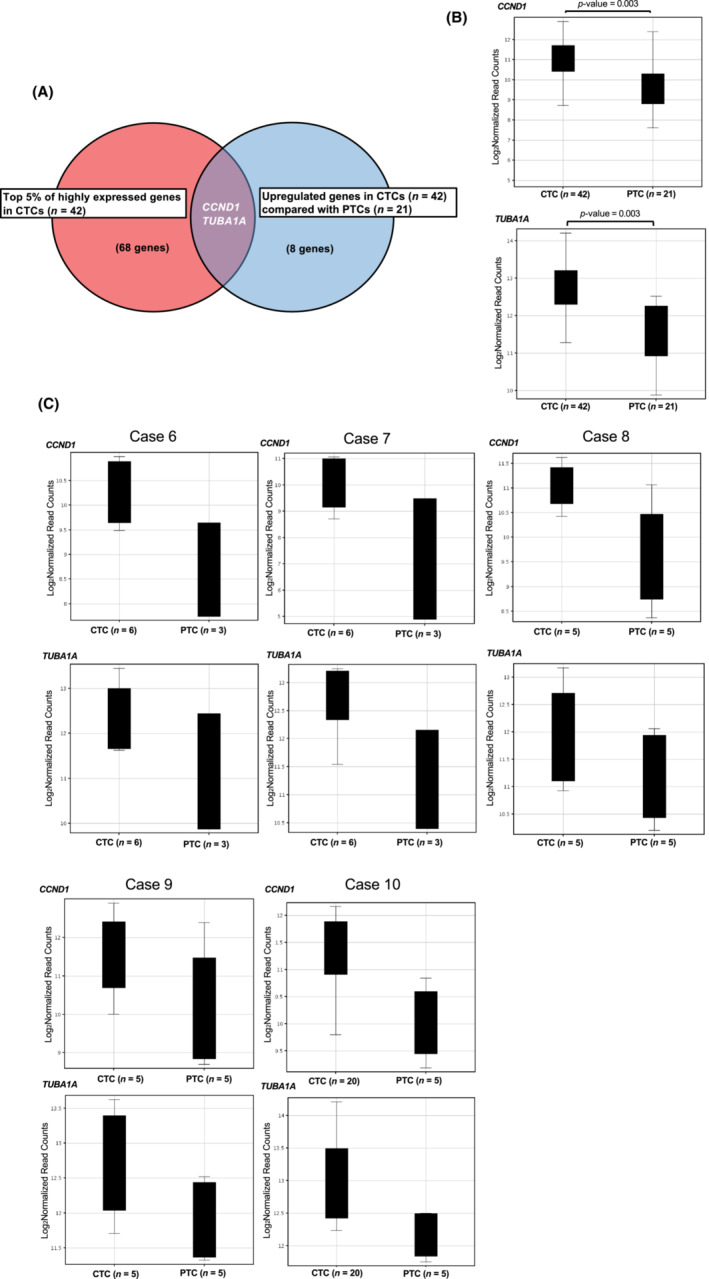
FIGURE 2.

RNA sequencing of primary tumor cells (PTCs) and circulating tumor cells (CTCs) at single‐cell level. (A, B) RNA sequencing was performed on 30 single neuroblastoma cells from biopsied tumor tissue (PTCs) and 48 single CTCs from five patients with neuroblastoma. In total, 21 single PTCs and 42 single CTCs were analyzed with over 500,000 reads from transcriptome. CCND1 and TUBA1A genes were in the top 5% of highly expressed genes in the CTCs and significantly upregulated compared with PTCs. (C) The trend of upregulation of CCND1 and TUBA1A in CTCs compared with PTCs was also observed in each case (cases 6–10).
