
FIGURE 2.
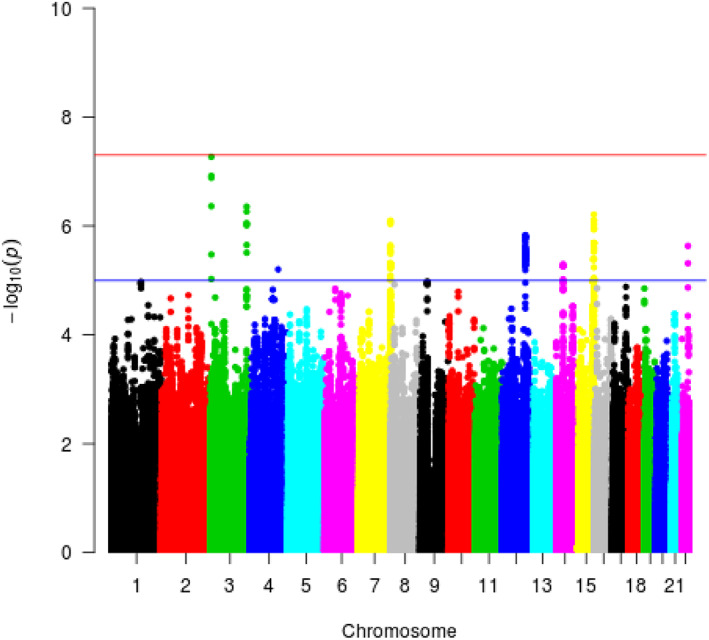
Manhattan plots for spatial conception ability. X‐axis represents the position of single nucleotide polymorphisms on each autosome, and y‐axis represents the significance of association with the phenotype. The horizontal blue line represents a threshold of significance that we specified (1 × 10⁻⁶). The horizontal red line represents the threshold for genome‐wide significance (5 × 10⁻⁸).