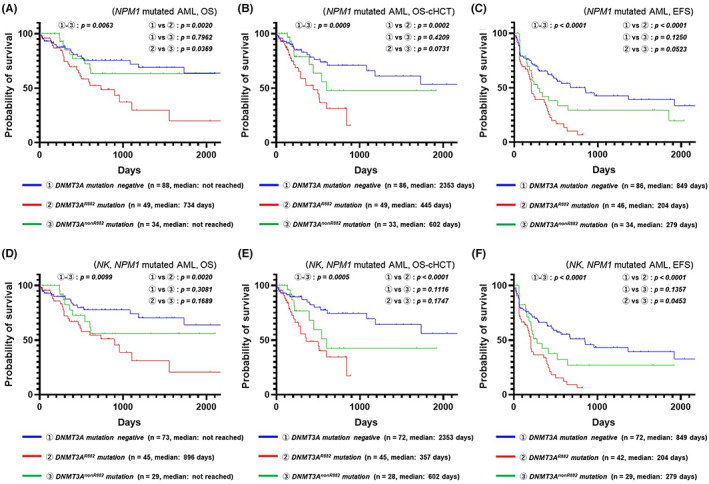
FIGURE 1.

Effect of DNMT3A mutations on the prognosis of NPM1‐mutated acute myeloid leukemia (AML). (A) Kaplan–Meier plots (overall survival; OS) comparing DNMT3A genotype subgroups for all karyotypes/NPM1‐mutated AML. (B) Kaplan–Meier plots (OS censored at allo‐HSCT) comparing DNMT3A genotype subgroups for all karyotypes/NPM1‐mutated AML. (C) Kaplan–Meier plots (event‐free survival; EFS) comparing DNMT3A genotype subgroups for all karyotypes/NPM1‐mutated AML. (D) Kaplan–Meier plots (OS) comparing DNMT3A genotype subgroups for normal karyotype (NK)/NPM1‐mutated AML. (E) Kaplan–Meier plots (OS censored at allo‐HSCT) comparing DNMT3A genotype subgroups for NK/NPM1‐mutated AML. (F) Kaplan–Meier plots (EFS) comparing DNMT3A genotype subgroups for NK/NPM1‐mutated AML
