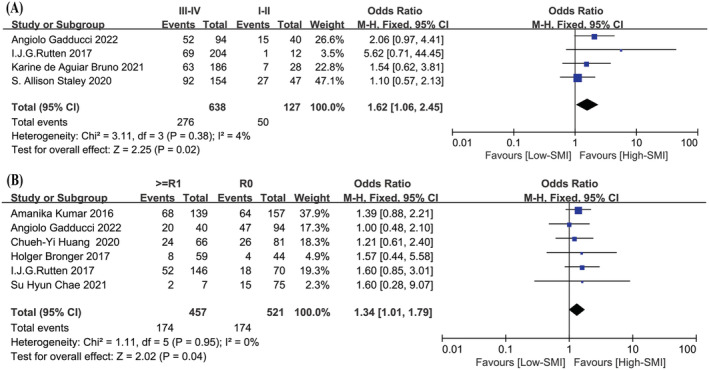
Figure 3.

The correlation between low SMI and clinicopathological features. (A) Forest plot assessing the correlation between low SMI and FIGO stage. (B) Forest plot assessing the correlation between low SMI and R0 cytoreduction. CI, confidence interval; df, degrees of freedom; M‐H, Mantel–Haenszel; SE, standard error.
