
Figure 5.
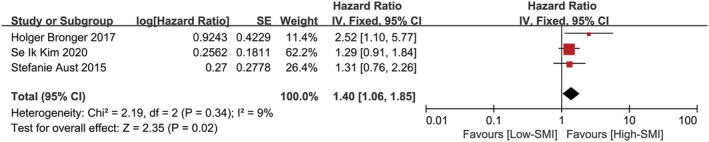
Forest plot assessing the correlation between low SMI and PFS. CI, confidence interval; df, degrees of freedom; IV, inverse variance; SE, standard error.
Official websites use .gov
A
.gov website belongs to an official
government organization in the United States.
Secure .gov websites use HTTPS
A lock (
) or https:// means you've safely
connected to the .gov website. Share sensitive
information only on official, secure websites.
Forest plot assessing the correlation between low SMI and PFS. CI, confidence interval; df, degrees of freedom; IV, inverse variance; SE, standard error.