
Figure 6.
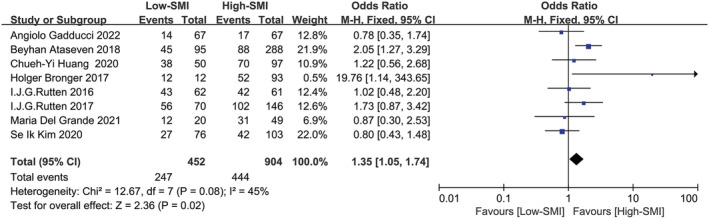
Forest plot assessing the correlation between low SMI and 5‐year overall survival rate. CI, confidence interval; df, degrees of freedom; M‐H, Mantel–Haenszel; SE, standard error.
Official websites use .gov
A
.gov website belongs to an official
government organization in the United States.
Secure .gov websites use HTTPS
A lock (
) or https:// means you've safely
connected to the .gov website. Share sensitive
information only on official, secure websites.
Forest plot assessing the correlation between low SMI and 5‐year overall survival rate. CI, confidence interval; df, degrees of freedom; M‐H, Mantel–Haenszel; SE, standard error.