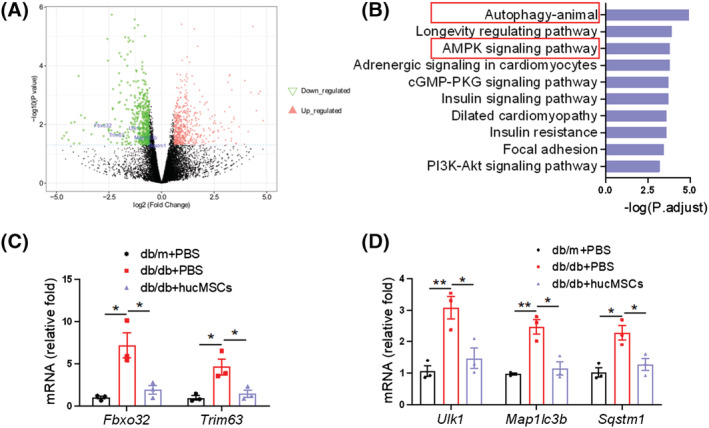
Figure 4.

RNA‐seq analysis of TA muscle from db/db mice. (A) The volcano map of differentially expressed genes (hucMSCs vs. PBS) identified by RNA‐seq analysis of TA muscle from db/db mice with PBS or hucMSCs treatment (n = 3 mice). (B) KEGG analysis of the enrichment pathways. (C) RT‐qPCR validation of Fbxo32(Atrogin1) and Trim63(MuRF1) (n = 3 mice). (D) RT‐qPCR validation of Ulk1, map 1lc3b and Sqstm1 (n = 3 mice). Data are mean ± SEM. (*P < 0.05, **P < 0.01 by two‐sided unpaired Student's t‐test).
