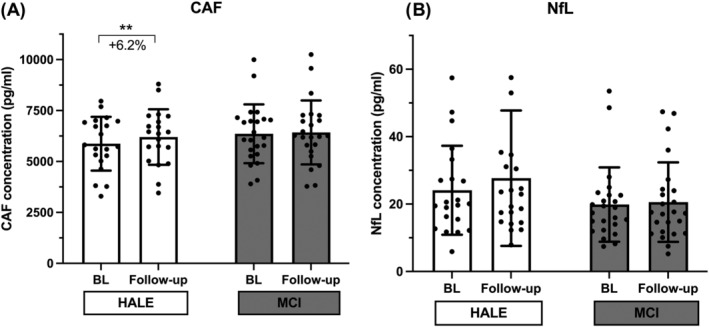
Figure 2.

C‐terminal agrin fragment (CAF) (A) and neurofilament light chain (NfL) (B) serum concentration variations in response to the 2‐year intervention: CAF and NfL values at baseline (BL) and follow‐up for the control (HALE) and intervention (MCI) groups, determined by mixed ANOVA. NfL values did not pass the normality test; thus, log10 transformation was applied; thereafter, normality test was passed. **P < 0.01 follow‐up versus BL.
