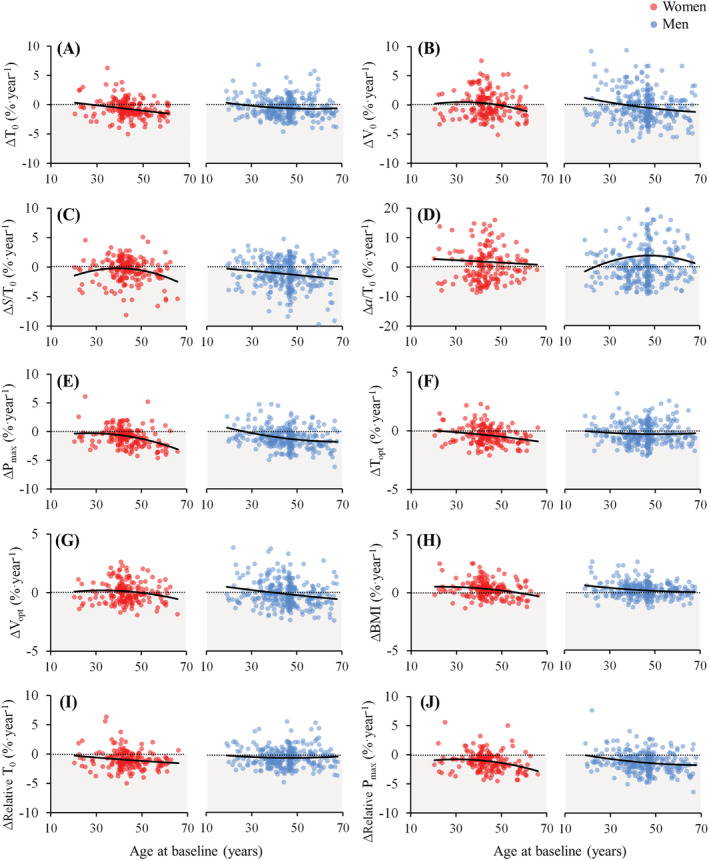
Figure 2.

Individual longitudinal annual percentage changes in the study outcomes as a function of baseline age in women and men. Longitudinal changes were calculated as the difference between follow‐up and baseline values divided by follow‐up time in years, and then relative to baseline levels. The dotted lines represent no change (i.e., zero) whereas the solid lines were calculated using regression analyses (2nd order polynomials) to represent the continuum of longitudinal percentage changes as a function of baseline age. ∆, change in a respective outcome; T0, estimated maximum isometric torque; V0, estimated maximum unloaded contraction velocity; S/T0, slope of the linear part of the torque‐velocity relationship; a/T0, curvature of the hyperbolic part of the torque‐velocity relationship; Pmax, maximum muscle power; Topt, optimal torque; Vopt, optimal velocity; BMI, body mass index.
