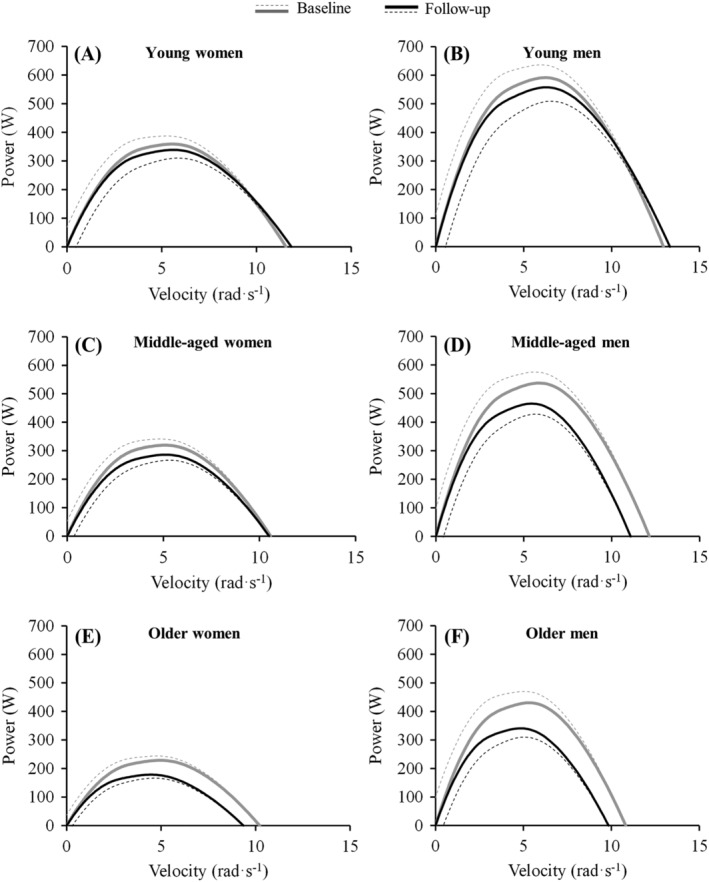
Figure 4.

Longitudinal changes observed after the 10‐year follow‐up in the power‐velocity relationship in young women and men, middle‐aged women and men, and older women and men. The dotted lines represent standard error of the estimate values, and the solid lines represent the hybrid equation used for modelling the torque‐velocity relationship that resulted in the power‐velocity relationship.
