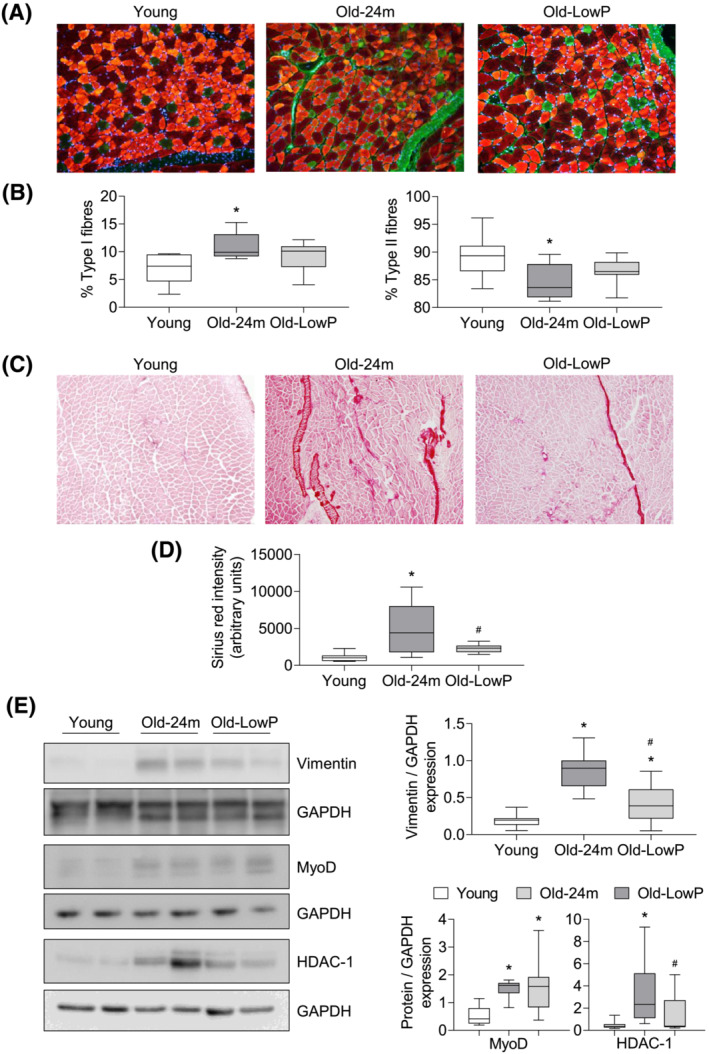
Figure 3.

Dietary restriction of phosphate prevents the aging‐related fibre‐type switching and muscle fibrosis observed in old mice. (A) Slow‐twitch (type I) and fast‐twitch (type II) fibres staining was performed in all groups. (B) The graphs represent the percentage of type I fibres (green) (left panel) or type II fibres (red) (right panel) and are expressed as the box plot from values obtained from eight young mice, eight old mice and nine old mice fed with the hypophosphataemic diet. (C) Collagen content in gastrocnemius muscle was measured by Sirius red staining. (D) The graph represents the densitometric analysis of the staining and the results are expressed as the box plot from 14 young mice, 12 old mice and 10 old mice fed with the hypophosphataemic diet. (E) Vimentin, MyoD and HDAC‐1 expressions were analysed by western blot in quadriceps samples. A represent blot of each protein is shown in the left panel. The graphs represent the box plot from values obtained from 15 young mice, 16 old mice and 16 old mice fed with the hypophosphataemic diet. *P < 0.05 versus Young, # P < 0.05 versus Old‐24m.
